errors and uncertainties in your ia
The treatment of errors and uncertainties is relevant in the internal assessment criteria of:
Owing to the nature of the subject, the concept of error and uncertainties in environmental systems and societies is probably less developed than in the group 4 courses. This is due to the nature of the data collected (especially in
fieldwork), which does not lend itself to an exhaustive analysis of error.
Investigations suitable for errors and uncertainties
Carrying out investigations
In a practical on productivity in terrestrial ecosystems, students study three similarly sized plots of vegetation. Plot 1 is harvested and weighed at the beginning of the practical. Plot 2 is covered in black plastic. Plot 3 is left untouched and allowed normal exposure to sunlight. At the end of the given period of time, plots 2 and 3 are harvested. By looking at the differences in the masses of plots 1 and 3, net primary productivity (NPP) can be calculated. The difference in mass between plots 1 and 2 would allow for the calculation of respiration.
To calculate productivity in kg m–2 yr–1 students would have to determine the dry weight of the vegetation, divide by the area of the plot, and further divide by the number of days for which the experiment ran (expressed as a fraction of a year). Calculation of the area of each plot would be necessary for the computation of productivity, but students
would not be expected to address the measurement uncertainty in the ruler or tape measure used to measure the sides of the plots. Students would also not be expected to address the uncertainty in the electronic (or other) balance or to
propagate errors. The greatest source of error in a study of this type would be either the excess earth in the sample or the loss of root material during harvesting. These errors overshadow any possible uncertainties in the measuring
devices to such a degree as to make them unimportant. However, because the noise-to-signal ratio is so high in fieldwork, in order to increase the probability of success, and to reduce sources of error to a minimum,
measurements must be as accurate as possible.
Use of equipment
A great deal of fieldwork relies upon kits or probes of one type or another. Students must be instructed in procedures to calibrate their equipment, and/or the running of standards where possible. These should be discussed in the write-ups. At the very least, mention should be made of whether the calibration of the apparatus was even possible. Consulting with a chemistry colleague should allow for the preparation of standards if, for example, a class will be studying phosphates in river water using a kit available from one of the various supply houses. An added advantage is that access to standards can turn a qualitative test into a semi-quantitative test. Although this does not address the concept
of uncertainty in itself, it does address the concept of accuracy in fieldwork.
Reporting on findings
A common problem lies in students’ treatment of significant figures and/or numbers of decimal places. Students should be able to use significant figures appropriately.
Table 1 is an extract from a laboratory book on productivity. The data in this table shows a disregard for significant figures. It is presented with accuracies varying from one to four significant figures (0 to 0.6583 or 1.918). If (as is presumed) all the measurements were carried out on the same scale, all should be reported to the nearest 0.0001 g or, alternatively, all should be rounded to the same number of decimal places. The problem lies in the fact that the number of decimal places is an indication of the uncertainty in the measurement. For example, the actual value for “Dry weight of population at start” lies between 1.6755 g and 1.6765 g, whereas “Dry weight of food made available to population” lies between 0.65825 g and 0.65835 g. This student would be penalized in aspect 1 of data collection and processing.
Table 1
- results, analysis and conclusions
Owing to the nature of the subject, the concept of error and uncertainties in environmental systems and societies is probably less developed than in the group 4 courses. This is due to the nature of the data collected (especially in
fieldwork), which does not lend itself to an exhaustive analysis of error.
Investigations suitable for errors and uncertainties
Carrying out investigations
In a practical on productivity in terrestrial ecosystems, students study three similarly sized plots of vegetation. Plot 1 is harvested and weighed at the beginning of the practical. Plot 2 is covered in black plastic. Plot 3 is left untouched and allowed normal exposure to sunlight. At the end of the given period of time, plots 2 and 3 are harvested. By looking at the differences in the masses of plots 1 and 3, net primary productivity (NPP) can be calculated. The difference in mass between plots 1 and 2 would allow for the calculation of respiration.
To calculate productivity in kg m–2 yr–1 students would have to determine the dry weight of the vegetation, divide by the area of the plot, and further divide by the number of days for which the experiment ran (expressed as a fraction of a year). Calculation of the area of each plot would be necessary for the computation of productivity, but students
would not be expected to address the measurement uncertainty in the ruler or tape measure used to measure the sides of the plots. Students would also not be expected to address the uncertainty in the electronic (or other) balance or to
propagate errors. The greatest source of error in a study of this type would be either the excess earth in the sample or the loss of root material during harvesting. These errors overshadow any possible uncertainties in the measuring
devices to such a degree as to make them unimportant. However, because the noise-to-signal ratio is so high in fieldwork, in order to increase the probability of success, and to reduce sources of error to a minimum,
measurements must be as accurate as possible.
Use of equipment
A great deal of fieldwork relies upon kits or probes of one type or another. Students must be instructed in procedures to calibrate their equipment, and/or the running of standards where possible. These should be discussed in the write-ups. At the very least, mention should be made of whether the calibration of the apparatus was even possible. Consulting with a chemistry colleague should allow for the preparation of standards if, for example, a class will be studying phosphates in river water using a kit available from one of the various supply houses. An added advantage is that access to standards can turn a qualitative test into a semi-quantitative test. Although this does not address the concept
of uncertainty in itself, it does address the concept of accuracy in fieldwork.
Reporting on findings
A common problem lies in students’ treatment of significant figures and/or numbers of decimal places. Students should be able to use significant figures appropriately.
Table 1 is an extract from a laboratory book on productivity. The data in this table shows a disregard for significant figures. It is presented with accuracies varying from one to four significant figures (0 to 0.6583 or 1.918). If (as is presumed) all the measurements were carried out on the same scale, all should be reported to the nearest 0.0001 g or, alternatively, all should be rounded to the same number of decimal places. The problem lies in the fact that the number of decimal places is an indication of the uncertainty in the measurement. For example, the actual value for “Dry weight of population at start” lies between 1.6755 g and 1.6765 g, whereas “Dry weight of food made available to population” lies between 0.65825 g and 0.65835 g. This student would be penalized in aspect 1 of data collection and processing.
Table 1
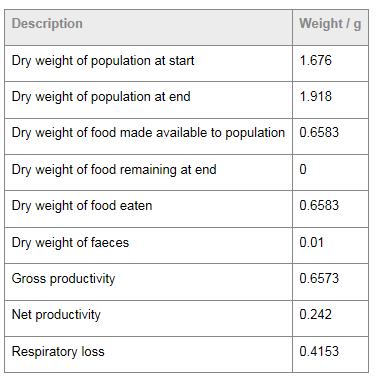
Note: The last three rows of this table are data processing and the units should not be expressed in
grams but in grams per unit time (for example, g day-1).
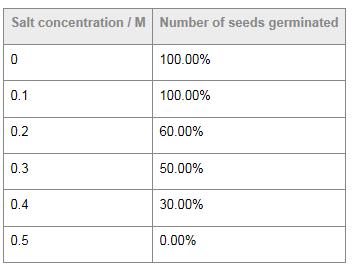
Table 2 shows data collected during a practical on the effect of salinity on seed germination. Given that ten seeds were planted in each of six petri dishes, reported percentages would be whole numbers. However, here the student has added two zeros to the right of the decimal point. It is inappropriate to report the percentages to the nearest hundredth. Furthermore, the second column heading is incorrect. This student would be penalized in aspect 2 of data collection
and processing.
Table 2
grams but in grams per unit time (for example, g day-1).
Table 2 shows data collected during a practical on the effect of salinity on seed germination. Given that ten seeds were planted in each of six petri dishes, reported percentages would be whole numbers. However, here the student has added two zeros to the right of the decimal point. It is inappropriate to report the percentages to the nearest hundredth. Furthermore, the second column heading is incorrect. This student would be penalized in aspect 2 of data collection
and processing.
Table 2
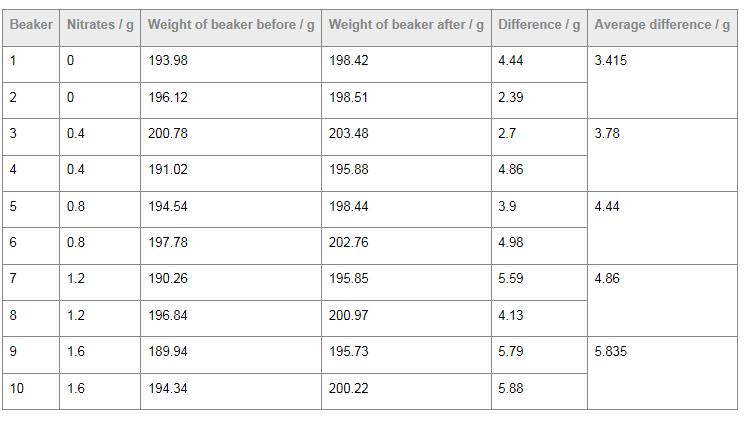
The same expectations hold for simple statistical calculations, such as means and standard deviations. In table 3, Average difference”, reported in the last column, is calculated from the two figures in the “Difference” column, immediately to the left, for each value of nitrates. The figure reported is simply the number given by the calculator. Each of these should be calculated to the number of significant figures in the least accurate of the measurements,
which in this case is three (the third value reported in the “Difference” column should really be 2.70 g). Introducing a third decimal place of accuracy, as has happened in the first and fifth values of the last column, is not acceptable and
would be penalized in aspect 2 of data collection and processing.
Table 3
In another example, suppose that, in a study of productivity, a student found that, in a 1.5 m2 plot, over a period of seven days, 1.345 g (dry weight) of tissue were produced. The student then calculated annual productivity in g m–2 yr–1. The calculation would look like this:
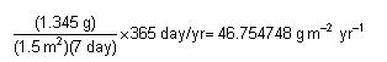
Clearly, reporting the answer to six decimal places is inappropriate, as is simply rounding to the nearest tenth
(46.7 g m2 yr–1).
(46.7 g m2 yr–1).
It would be incorrect to suppose that the work is accurate enough to estimate annual productivity to the nearest tenth of a gram. The correct rounding procedure is to use the least accurate quantity in the calculations (seven days) and to
report the answer to the same number of significant figures, namely one.
Therefore, the correct estimate of annual productivity based on these data would be 50 g m–2 yr–1.
One of the most important skills that a student of environmental systems and societies can learn is how to take a
representative sample during fieldwork. If you are to randomly sample a local ecosystem, care should be taken to
ensure that the sample is in fact random. The guiding principle is that every location in the study area must have an
equal chance of being sampled. If you are sampling a football field by standing in the middle of the field, throwing a
rock, and then placing a quadrat where the rock lands, clearly there is not an equal chance of every location being sampled. Working with coordinates and random number generators would ensure randomness in this example. The choice of location can also be systematic or stratified as long as you are consistent.
In many practicals, students use quadrats to determine percentage cover. Care must be taken to ensure that the sample is representative (at the very least, you should recognize that, due to time constraints, samples may not always be representative). How many quadrats will be sampled, and what is the correct size of quadrat to be used? You can keep a cumulative species log to determine when the number of species stops increasing. This will determine the correct number of quadrats, and the number established can be used for later fieldwork on the same habitat.
To minimize uncertainty in fieldwork, you must ensure that random, representative data is being collected. Where this
is not possible, you should be aware of the limitations of your sample, and indicate this in your reports.
Finally, when you calculate various statistics from your data, some comment should be made on the results of these statistics in the discussion, evaluation and conclusion section(s) of your investigation.
adapted from © International Baccalaureate Organization
