internal assessment - analysis
Analysis
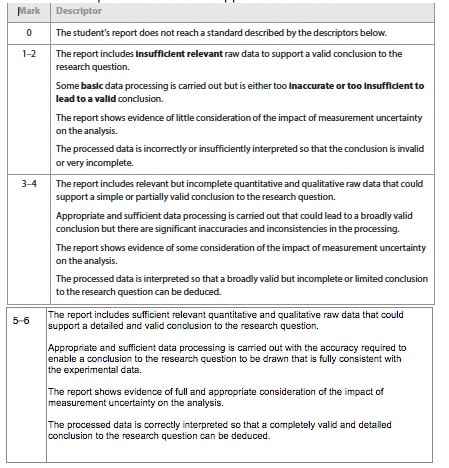
This criterion assesses the extent to which your report provides evidence that you has selected, recorded, processed and interpreted the data in ways that are relevant to the research question and can support a conclusion.
Raw Data:
Raw data is the data you collect during the investigation to help answer the research question. Raw data can be quantitative (numbers) and/or qualitative (descriptions). The best way to record data is by using data tables. Give a clear title to each data table. Number tables consecutively through the report.
Data Processing:
This is where raw data is transformed into results that answer the research question. You will show the calculations that give a numerical result. Statistics are useful mathematical tools which are used to analyze data.
This criterion assesses the extent to which your report provides evidence that you has selected, recorded, processed and interpreted the data in ways that are relevant to the research question and can support a conclusion.
Raw Data:
- Data is collected for a minimum of 5 levels over a suitable range of the IV.
- Data is collected for a minimum of 5 repeats (for Standard Deviation, more for correlations).
- Data is collected to show consistency of CV.
- Insightful and thorough qualitative data (observations and/or photos).
- All data are recorded correctly and honestly.
Raw data is the data you collect during the investigation to help answer the research question. Raw data can be quantitative (numbers) and/or qualitative (descriptions). The best way to record data is by using data tables. Give a clear title to each data table. Number tables consecutively through the report.
Data Processing:
- Calculations to determine DV, if necessary (i.e. rate)
- Mean and standard deviations included, where appropriate,
- Calculations and/or significance tests appropriate to investigation
- Justification of the data processing methods.
- Statistical tests include full details including null and alternative hypothesis, DF, critical values and probability levels.
- Formula, Excel formula, worked example or screen shot of calculations given.
- Appropriate choice of graph with variables on the appropriate axis
This is where raw data is transformed into results that answer the research question. You will show the calculations that give a numerical result. Statistics are useful mathematical tools which are used to analyze data.
For help you can go to the Biology For Life Link on,
Error Bars,
Error Analysis
Mean
Standard Deviation
Student t-Test
Analysis of Variance (ANOVA)
Correlation
Chi-Square Test
Error Bars,
Error Analysis
Mean
Standard Deviation
Student t-Test
Analysis of Variance (ANOVA)
Correlation
Chi-Square Test
Data processing involves combining and manipulating raw data to determine the value of a physical quantity (such as adding, subtracting, squaring, dividing), and taking the average of several measurements and transforming data into a form suitable for graphical representation. It might be that the data is already in a form suitable for graphical presentation, for example, distance traveled by woodlice against temperature. If the raw data is represented in this way and a best-fit line graph is drawn, the raw data has been processed. Plotting raw data (without a graph line) does not constitute processing data.
You should present your work for processed data so that all the stages to the final result can be followed.
Impact of Uncertainty:
In addition to reporting the correct measurement uncertainty, you must explain the impact (or not) of the measurement uncertainty on the results and/or conclusion.
Interpretation of Processed Data:
You should present your work for processed data so that all the stages to the final result can be followed.
- Show at least one example of the working required for each data processing calculation.
- Inclusion of metric units are expected for final derived quantities, which should be expressed to the correct number of significant figures.
- Show the units of measurements in all calculations. Pay attention to significant digits! Don’t lose accuracy by carelessly rounding off.
Impact of Uncertainty:
- Correct uncertainty reported for raw measurements.
- Uncertainties justified and/or explained.
- Correct and consistent number of digits throughout.
- Discussion of the size of uncertainties compared to the data collected.
- SD error bars included and labeled on graphs
In addition to reporting the correct measurement uncertainty, you must explain the impact (or not) of the measurement uncertainty on the results and/or conclusion.
Interpretation of Processed Data:
- Patterns in the data related to the RQ stated, with specific numerical reference to graphs/tables.
- Data pointed joined to illustrate the trend (unless comparing qualitative IV).
- Patterns and trends in data described with reference to graphs.
- Variation (i.e. SD) within the data discussed.
- Correct conclusion of significance is drawn.
Data Tables
- Title the table; make sure the title relates to the data you will put in your table. The data table title is NOT a repeat of the research question; the title SHOULD be descriptive of the data contained in the table.
- Figure out how many columns and rows are needed. Rows are a series of horizontal cells and columns are a series of vertical cells. Although not required, in most cases the manipulated variable (that which is purposefully changed) is in the left column, the raw data for the responding variable (that which you measure) with the different trials is in the next columns, and the processed data (often average and standard deviation) is in the far right column. Be sure to include a row for the heading of each column.
- Draw the table with a program like Microsoft Excel or Google Sheets. Show lines around all rows and columns. Be sure the table does not break across multiple pages.
- Label the columns, including units and measurement uncertainty of the raw data.
- Record the data from the experiment or research in the appropriate columns. The information in the table must be clear and obvious When you're finished there should be a number in every space. All numerical values must have the consistent and correct number of digits. There should be no variation in the precision of the data; the same number of decimal places (significant digits) should be used.
- Check your table. Look over the work to make sure everything is correct and clear
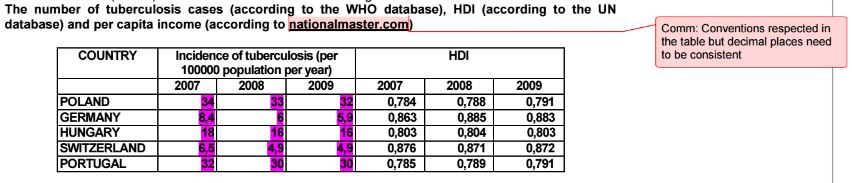
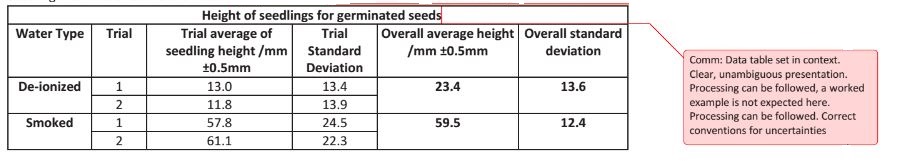
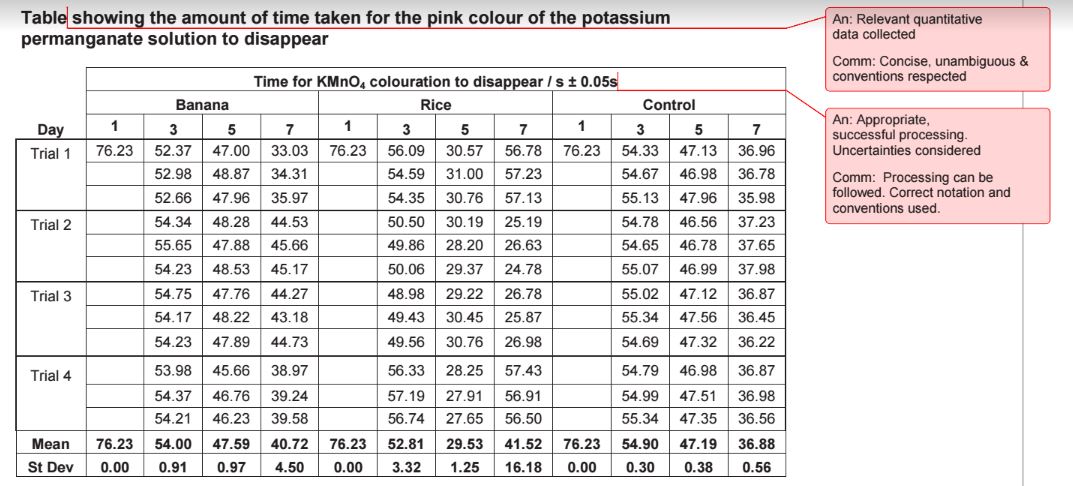
Table Samples from IBO
Graphing