topic 5.4: cladistics
In the Cladistics unit we will look at how the building components of living organisms are not only simple in structure but are also universal. We will see that the Cladistics is an approach to biological classification in which organisms are categorized based on shared derived characteristics that can be traced to a group's most recent common ancestor and are not present in more distant ancestors. Therefore, members of a group are assumed to share a common history and are considered to be closely related
This unit will last 3 school days
This unit will last 3 school days
Essential idea:
- The ancestry of groups of species can be deduced by comparing their base or amino acid sequences.
Nature of science:
- Falsification of theories with one theory being superseded by another—plant families have been reclassified as a result of evidence from cladistics. (1.9)
- Outline the reason why biological theories may change with time.
- Outline the reason why biological theories may change with time.
Understandings:
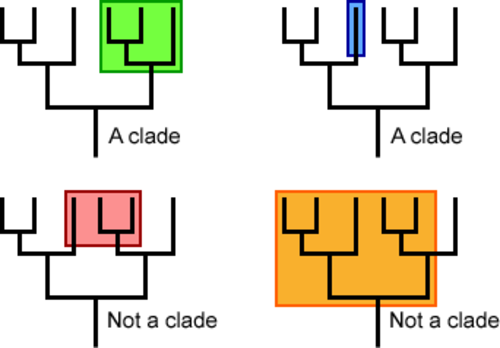
5.4 U1 A clade is a group of organisms that have evolved from a common ancestor. (Oxford Supplemental Guide page 269)
- Define clade and cladistics.
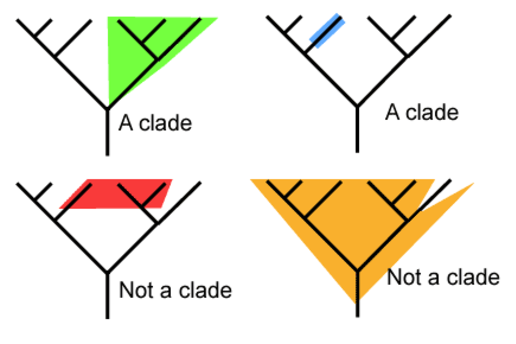
Over time species evolve and split to form new species. This process can occur repeatedly with some highly successful species leading to a large group of organisms that share a common ancestor. These groups of species evolved from a common ancestor, that have shared characteristics is called a clade is a method of classifying organisms into groups of species called clades (from Greek ‘klados' = branch)
- Each clade consists of an ancestral organism and all of its evolutionary descendants
- Members of a clade will possess common characteristics as a result of their shared evolutionary lineage
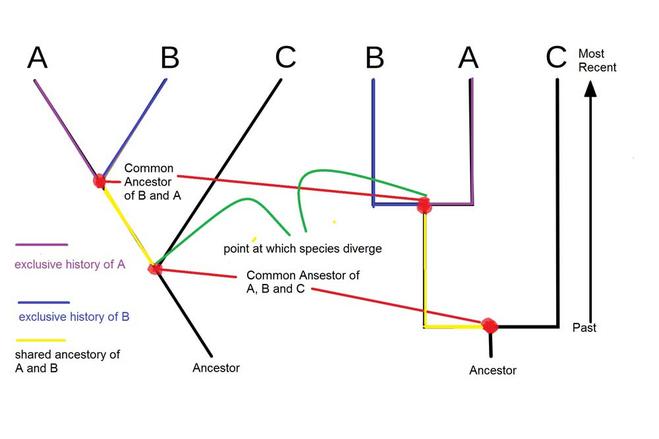
- Branch points in the tree represent the time at which the two taxa spilt from each other
- The degree of divergence between branches represent the differences that have developed between the two taxa since they diverged
5.4.U2 Evidence for which species are part of a clade can be obtained from the base sequences of a gene or the corresponding amino acid sequence of a protein. (Oxford Supplemental Guide page 270)
- Outline the relationship between time, evolutionary relationships and biological sequences (nitrogenous base or amino acid).
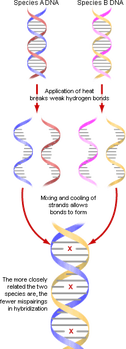
All organisms use DNA and RNA as genetic material and the genetic code by which proteins are synthesised is (almost) universal. This shared molecular heritage means that base and amino acid sequences can be compared to ascertain levels of relatedness. Over the course of millions of years, mutations will accumulate within any given segment of DNA
Sometimes determining which species are part of a certain clade is difficult. The most accurate evidence is derived from amino acid sequences of certain proteins, such as Hemoglobin and Cytochrome C and from base sequences of genes
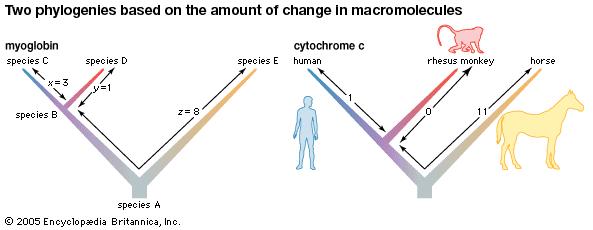
Differences between molecules can be used as part of the evidence to deduce phylogenetic relationships
Link on similarities between human and chimpanzee DNA http://bit.ly/1DXeU0N
Scientific American Article http://bit.ly/1HkmRwt
Sometimes determining which species are part of a certain clade is difficult. The most accurate evidence is derived from amino acid sequences of certain proteins, such as Hemoglobin and Cytochrome C and from base sequences of genes
Differences between molecules can be used as part of the evidence to deduce phylogenetic relationships
- phylogeny = the evolutionary history of a taxonomic group, often shown in a phylogenetic tree
- mutations in DNA occur with predictable rates
- differences can be used as a molecular clock to develop phylogeny
- DNA nucleotide sequences
- protein amino acid sequences
- globin genes are present in all animals and some plants
- the greater the similarity in the globin genes of two species, the less time has passed during which mutations could accumulate, and thus, the degree of similarity can be used as a measure of how closely related the two species are
- the greater the similarity in a protein produced by two species, the more recently they shared a common ancestor
- the greater the difference in a protein produced by two species, the more distantly they shared a common ancestor
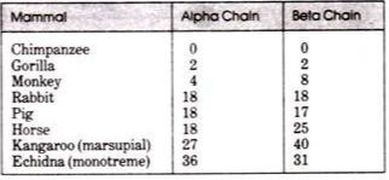
- The sequences for alpha and beta hemoglobin are known for humans, chimpanzees, and gorillas. Humans and chimpanzees have identical alpha and beta sequences from which gorillas differ by only one residue in each chain.
- On position 23 on the alpha hemoglobin, for example, gorillas have the amino acid aspartic acid instead of glutamic acid and at position 104 on beta hemoglobin gorillas have lysine instead of arginine.
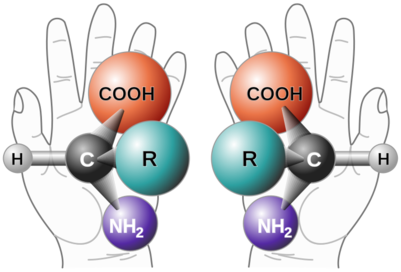
- Amino acids also have either right-handed or left-handed orientation
- The majority of organisms on earth use left-handed amino acids to build their proteins and only a small number use right-handed amino acids (mostly certain bacteria). This implies common ancestry for these life forms with the same amino acid orientation
Link on similarities between human and chimpanzee DNA http://bit.ly/1DXeU0N
Scientific American Article http://bit.ly/1HkmRwt
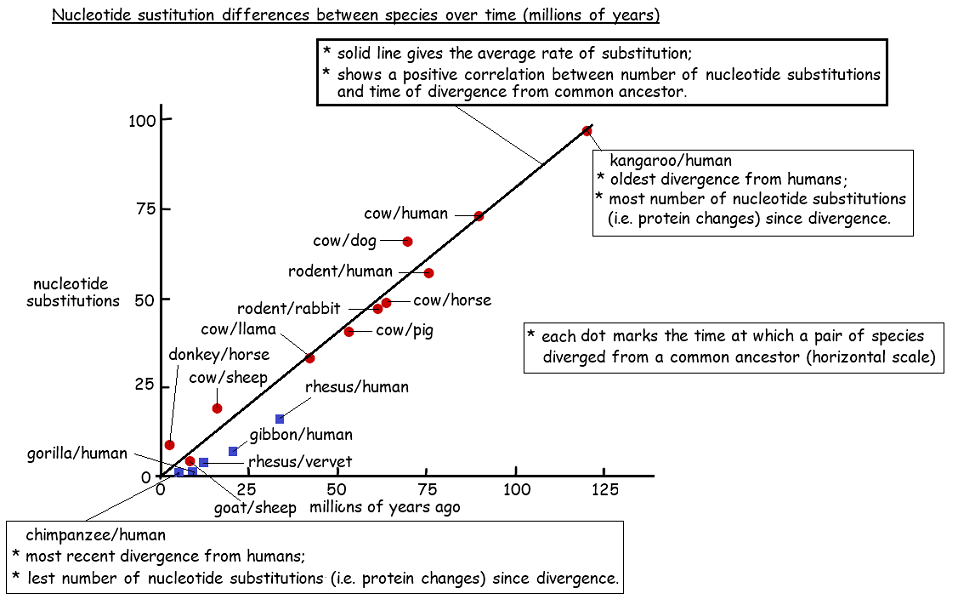
5.4.U3 Sequence differences accumulate gradually so there is a positive correlation between the number of differences between two species and the time since they diverged from a common ancestor (Oxford Supplemental Guide page 271)
- Outline the use of a “molecular clock” to determine time since divergence between two species.
- State the source of differences between biological sequences (nitrogenous base or amino acid).
Differences in nucleotide base sequences in DNA, and therefore amino acid sequences in proteins, accumulate gradually over long periods of time
- differences accumulate at roughly constant and predictable rate
- therefore, the number of differences can be used as a clock
- to measure the time since two divergent groups shared a common ancestor
- however, variations are partly due to mutations
- which are unpredictable chance events
- so there must be caution in interpreting data
- horse: 18
- mouse: 16
- reptile: 35
- frog: 62
- shark: 79
- mammals: originated 70 million years ago
- reptile: originated 270 million years ago
- frog: originated 350 million years ago
- shark: originated 450 million years ago
- Hemoglobin changes at a regular rate over hundreds of millions of years, acting as a molecular clock.
- A variety of proteins have been studied, each producing its own molecular clock.
- Histones (organize DNA) hardly change at all.
- Cytochrome c (a mitochondrial protein) changes slowly.
- Hemoglobin (blood protein) changes moderately.
- Fibrinopeptides (clotting proteins) change rapidly.
5.4.U4 Traits can be analogous or homologous. (Oxford Supplemental Guide page 271)
- Contrast analogous and homologous traits.
- State an example of analogous and homologous traits.
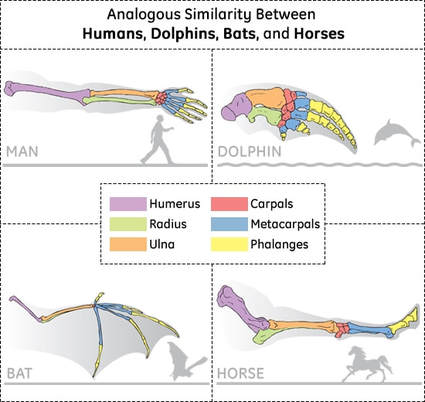
Analogous characteristics: structures with a common function, but a different evolutionary origin
- example: dolphin fins and shark fins
- example: dolphin forelimbs and human arms
5.4.U5 Cladograms are tree diagrams that show the most probable sequence of divergence in clades. (Oxford Supplemental Guide page 272)
- Define cladogram and node.
- Outline how computer programs analyze biological sequence data to create cladograms.
- Identify members of clades given a cladogram.
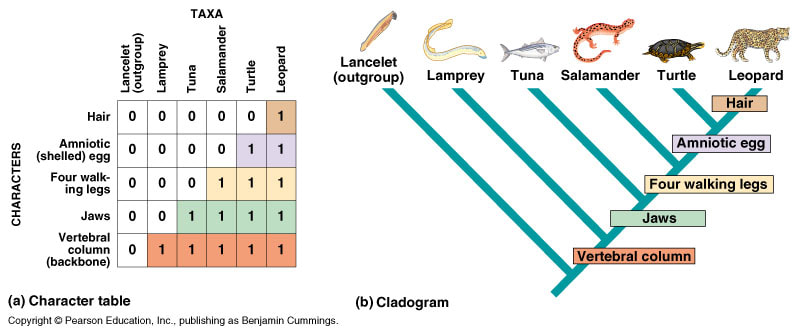
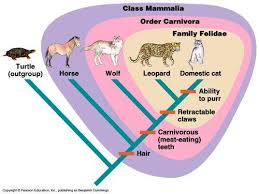
Cladograms are tree diagrams where each branch point represents the splitting of two new groups from a common ancestor. Each branch point (node) represents a speciation event by which distinct species are formed via divergent evolution. Cladograms show the probable sequence of divergence and hence demonstrate the likely evolutionary history (phylogeny) of a clade. The fewer the number of nodes between two groups the more closely related they are expected to be.
The strength of cladistics is that the comparisons are objective, relying on morphological and molecular homologies
The weakness of cladistics is that molecular differences are analysed on the basis of probabilities
The strength of cladistics is that the comparisons are objective, relying on morphological and molecular homologies
The weakness of cladistics is that molecular differences are analysed on the basis of probabilities
- improbable events occasionally occur, making the analyses wrong
5.4.U6 Evidence from cladistics has shown that classifications of some groups based on structure did not correspond with the evolutionary origins of a group or species. (Oxford Supplemental Guide page 262)
- Outline the role of technological advancements in the development of cladistics.
- Explain why the development of cladistics lead to the reclassification of some species.
Historically, classification was based primarily on morphological differences (i.e. structural characteristics). Closely related species were expected to show similar structural features, indicating common ancestry. However, there are two key limitations to using morphological differences as a basis for classification:
The classification of many groups has been re-examined using cladograms.
- Closely related organisms can exhibit very different structural features due to adaptive radiation (e.g. pentadactyl limb)
- Distantly related organisms can display very similar structural features due to convergent evolution
The classification of many groups has been re-examined using cladograms.
- in many cases, cladograms have confirmed existing classifications, as expected, since both are based on phylogeny
- in some cases, cladograms can be difficult to reconcile with traditional classifications
- nodes can be placed at any point
- making the fit of taxa to the cladogram arbitrary
- insome cases, cladograms radically alter existing classifications
- for example, birds are grouped within a clade including dinosaurs
Application
5.4.A1 Cladograms including humans and other primates. (Oxford Supplemental Guide page 272)
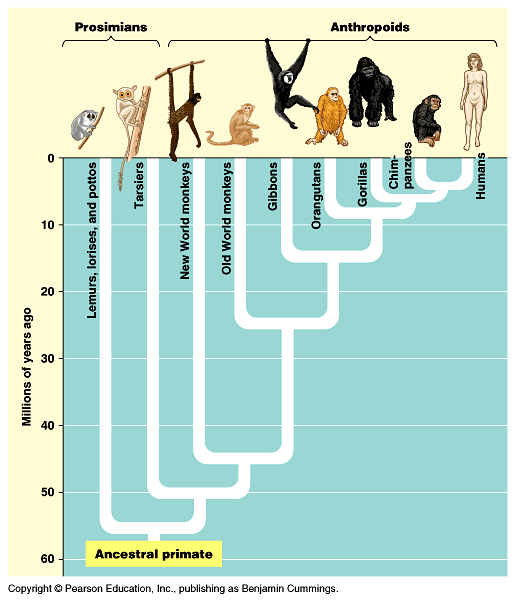
- Interpret a cladogram depicting primate species.
Cladograms can show evolutionary relationships and demonstrate how recently two groups shared a common ancestry
According to a cladogram outlining the evolutionary history of humans and other primates:
Draw a cladogram containing humans and other primates based on the order listed in the immunological study table above in the previous understanding
- As each node represents a point of divergence, closely related species will be separated by fewer nodes
According to a cladogram outlining the evolutionary history of humans and other primates:
- Humans, chimpanzees, gorillas, orangutans and gibbons all belong to a common clade – the Hominoids
- The Hominoid clade forms part of a larger clade – the Anthropoids – which includes Old World and New World monkeys
Draw a cladogram containing humans and other primates based on the order listed in the immunological study table above in the previous understanding
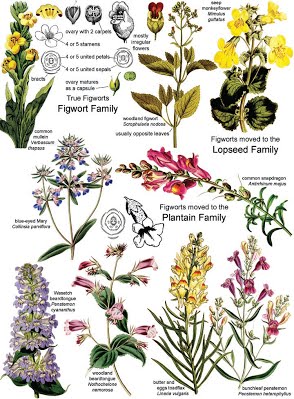
5.4.A2 Reclassification of the figwort family using evidence from cladistics (Oxford Supplemental Guide page 275)
- Outline the reason and evidence for the reclassification of the figwort family.
Until recently, figworts were the 8th largest family of flowering plants (angiosperms), containing 275 different genera. This was problematic as many of the figwort plants were too dissimilar in structure to function as a meaningful grouping.
Taxonomists examined the chloroplast gene in figworts and decided to split the figwort species into five different clades
Taxonomists reclassifed the Figwort family for the following reasons:
Taxonomists examined the chloroplast gene in figworts and decided to split the figwort species into five different clades
- An example of the reclassification of an organism is the Family Scrophlahulariaceae
- At one point this family consisted of over 275 genera and 5000 species
- Scientists recently used cladistics to reclassify the Figworts family
- They focused on the base sequences of three chloroplast genes and discovered that the species in the Figwort family were not one clade but five clades and had been incorrectly grouped together into one family
Taxonomists reclassifed the Figwort family for the following reasons:
- Taxonomists attempt to group plant species by using information from many sources, such as floral and fruit morphology, embryology, wood anatomy, leaf architecture, cytology, genetic and fossil records
- Lack of uniquely defining traits raises the possibility that the figwort family are not monophyletic (i.e. contain only one clade)
- Some researchers suggested that the figwort family are polyphyletic (i.e. contains more that on clade)
- DNA sequencing of three chloroplast genes, researchers were able to determine that there were significant differences in lineage. Therefore, the entire figwort family was reclassified into six monophyletic families. However, no classification is ever complete or universally accepted and more refinements are likely in the future
Skill
5.4.S1 Analysis of cladograms to deduce evolutionary relationships. (Oxford Supplemental Guide page 273)
- Analyze a cladogram to explain the evolutionary relationship between species.
- Discuss the use of cladograms as hypotheses of evolutionary relationships.
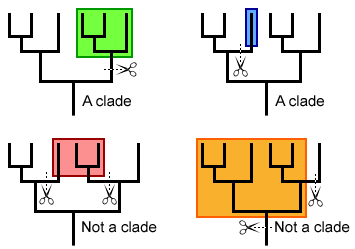
These are some pictures outlining which part of a cladogram is a clade and another picture I created on ancestry using a cladogram. The red dots are called nodes, and represent the time when two species are estimated to have split.
One thing to note, just because a species like C split earlier than from B, it does not mean that B has evolved more. All the species at the top are present D species. The ones that have died out or changed would be at the nodes.
Create your own cladogram that contains at least 8 organisms using biochemical evidence such as DNA, Protein similarities or immunological studies.
Click on Go to Cladogram Analysis to go to webpage to practice deducing evolutionary relationships
Go to Cladogram Analysis
Go to Cladogram Analysis
Key Terms
|
clades
DNA sequence hybridization node variation |
DNA
evolutionary clock analogous evolutionary clocks phylogenetic relationships analogous characteristics |
amino acids
polypeptide cladograms cladistics common ancestry |
variation
homologous reclassification characteristics cladogram |
phylogeny
mutation outgroup morphology |
Powerpoint and Notes for Topic 5.4 from Chris Payne
Your browser does not support viewing this document. Click here to download the document.
Your browser does not support viewing this document. Click here to download the document.
Correct use of terminology is a key skill in Biology. It is essential to use key terms correctly when communicating your understanding, particularly in assessments. Use the quizlet flashcards or other tools such as learn, scatter, space race, speller and test to help you master the vocabulary.
External Links:
Tree of Life Interaction
How to read a phylogenic tree
Do birds of a feather flock together?
Phylogenetic trees McGraw Hill Education
In the News:
This new, ‘complete’ tree of life shows how 2.3 million species are related, Washington Post September 21, 2015
Deep sea microbes may be closest relative of complex cells Science, May. 6, 2015
TOK:
- A major step forward in the study of bacteria was the recognition in 1977 by Carl Woese that Archaea have a separate line of evolutionary descent from bacteria. Famous scientists, including Luria and Mayr, objected to his division of the prokaryotes. To what extent is conservatism in science desirable
Video Clip:
By providing a chronicle of past evolutionary events, phylogenetic trees have become central to understanding the process of evolution, and therefore to the interpretation of all biological information. Phylogenetic comparisons with model organisms (such as the chimpanzee, mouse, zebra fish, and yeast) are providing major insights into the structure and function of the human genome, knowledge that will enable us to address a wide variety of human disorders.
Using newts, coyotes and mice, Jason Munshi-South shows how animals develop genetic differences in evolution, even within an urban city.
