MYP Science Laboratory guidance
How to Write Your MYP Science Lab Report
Use this page to help you create a successful MYP Science Lab Report. You will find some helpful guidelines concerning the writing of your lab report. Keep in mind these are general guidelines
The following is a rough outline through the various sections of a lab report. Keep in mind that different research in different subject may emphasize different aspects.
The following is a rough outline through the various sections of a lab report. Keep in mind that different research in different subject may emphasize different aspects.
- Title
- Research Question
- Relevant Background Information*
- Hypothesis*
- Variables
- Materials and Method
- Raw Data
- Processed Data
- Data Presentation
- Data Analysis
- Data Discussion
- Conclusion*
- Evaluation
- Bibliography
myp biology criteria b
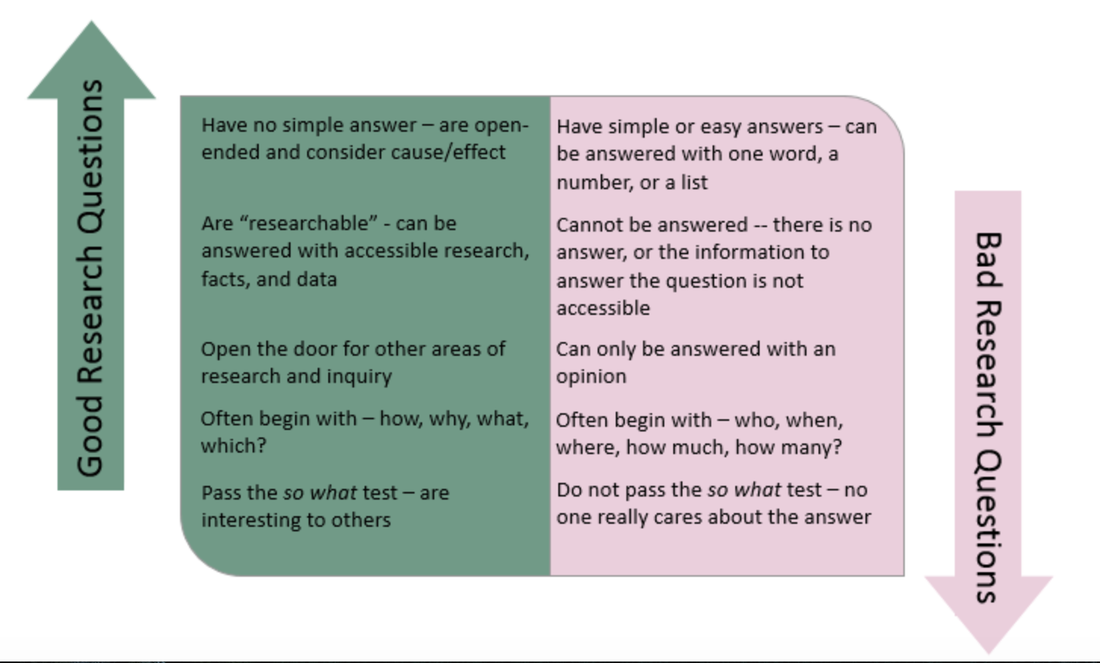
How To Write A Research Question
A research question is the question around which you center your research. It should be:
Unfocused: What is the effect on the environment from global warming?
The unfocused research question is so broad that it couldn’t be adequately answered in a book-length piece, let alone a standard college-level paper.
Focused: What is the most significant effect of glacial melting on the lives of penguins in Antarctica?
The focused version narrows down to a specific effect of global warming (glacial melting), a specific place (Antarctica), and a specific animal that is affected (penguins). It also requires the writer to take a stance on which effect has the greatest impact on the affected animal. When in doubt, make a research question as narrow and focused as possible.
A research question is the question around which you center your research. It should be:
- clear: it provides enough specifics that one’s audience can easily understand its purpose without needing additional explanation.
- focused: it is narrow enough that it can be answered thoroughly in the space the writing task allows.
- concise: it is expressed in the fewest possible words.
- complex: it is not answerable with a simple “yes” or “no,” but rather requires synthesis and analysis of ideas and sources prior to composition of an answer.
- arguable: its potential answers are open to debate rather than accepted facts.
Unfocused: What is the effect on the environment from global warming?
The unfocused research question is so broad that it couldn’t be adequately answered in a book-length piece, let alone a standard college-level paper.
Focused: What is the most significant effect of glacial melting on the lives of penguins in Antarctica?
The focused version narrows down to a specific effect of global warming (glacial melting), a specific place (Antarctica), and a specific animal that is affected (penguins). It also requires the writer to take a stance on which effect has the greatest impact on the affected animal. When in doubt, make a research question as narrow and focused as possible.
https://libguides.umgc.edu/c.php?g=709287&p=5388938
Background Information
Background research should be directly related to your research question and your variables.
Background research should be directly related to your research question and your variables.
- Reasonable justification for why you are experimenting using these variables.
- Supported by reliable, credible research.
- Reference scientific journals
- Discuss any important science concepts that will be needed to understand the question, results, etc.
- ALL information should be in-text cited using a recognized format (MLA, APA, Chicago, etc), a bibliography should then be created at the end of the report.
You Hypothesis
Goal
Your hypothesis can be one well-written sentence or an entire paragraph. It should sound something like “If...then...because...”. IF you change your independent variable, THEN you predict this change in your dependent variable, BECAUSE of the scientific explanation that you offer. Your reasoning should be based on scientific research from your background information. Your background information should be relevant to your experiment and your predicted hypothesis.
It is acceptable for your research to suggest that your hypothesis is right, wrong (or uncertain) by your experiment, but it is NOT acceptable to write your hypothesis after your experiment or to change your hypothesis during your experiment.
A hypothesis will:
Developing a hypothesis
Strong hypothesis: Aphid-infected plants that are exposed to ladybugs will have fewer aphids after a week than aphid-infected plants which are left untreated.
This hypothesis gives a clear indication of what is to be tested (the ability of ladybugs to curb an aphid infestation), is a manageable size for a single experiment, mentions the independent variable (ladybugs) and the dependent variable (number of aphids), and predicts the effect (exposure to ladybugs reduces the number of aphids)."
Poor hypothesis: Ladybugs are a good natural pesticide for treating aphid infected plants.
This statement is not 'bite size.' Whether or not something is a 'good natural pesticide' is too vague for a science fair project. There is no clear indication of what will be measured to evaluate the prediction."
Goal
- Help explain the focus and direction of the experiment or research.
- Based on existing theories and knowledge.
- Testable, which means you can support or refute it through scientific research methods (such as experiments, observations and statistical analysis of data).
- NOT just a guess — it should be
Your hypothesis can be one well-written sentence or an entire paragraph. It should sound something like “If...then...because...”. IF you change your independent variable, THEN you predict this change in your dependent variable, BECAUSE of the scientific explanation that you offer. Your reasoning should be based on scientific research from your background information. Your background information should be relevant to your experiment and your predicted hypothesis.
It is acceptable for your research to suggest that your hypothesis is right, wrong (or uncertain) by your experiment, but it is NOT acceptable to write your hypothesis after your experiment or to change your hypothesis during your experiment.
A hypothesis will:
- State the purpose of the research/investigation
- Identify what variables that are used
- Be logical
- Use precise language
- Be testable with research or experimentation
Developing a hypothesis
- Ask a question - Writing a hypothesis begins with your research question. The question should be focused, specific, and researchable within the constraints of your project.
- Background research - Your initial answer to the question should be based on what is already known about the topic. Look for theories and previous studies to help you form educated assumptions about what your research will find
- Formulate your hypothesis - Write your initial answer to the question in a clear, concise sentence.
- Refine your hypothesis - You need to make sure your hypothesis is specific and testable. There are various ways of phrasing a hypothesis, but all the terms you use should have clear definitions. Identify the variables, you can write a simple prediction in if…then form. The first part of the sentence states the independent variable and the second part states the dependent variable.
- The hypothesis should contain:
- The relevant variables
- The specific group being studied
- The predicted outcome of the experiment or analysis
Strong hypothesis: Aphid-infected plants that are exposed to ladybugs will have fewer aphids after a week than aphid-infected plants which are left untreated.
This hypothesis gives a clear indication of what is to be tested (the ability of ladybugs to curb an aphid infestation), is a manageable size for a single experiment, mentions the independent variable (ladybugs) and the dependent variable (number of aphids), and predicts the effect (exposure to ladybugs reduces the number of aphids)."
Poor hypothesis: Ladybugs are a good natural pesticide for treating aphid infected plants.
This statement is not 'bite size.' Whether or not something is a 'good natural pesticide' is too vague for a science fair project. There is no clear indication of what will be measured to evaluate the prediction."
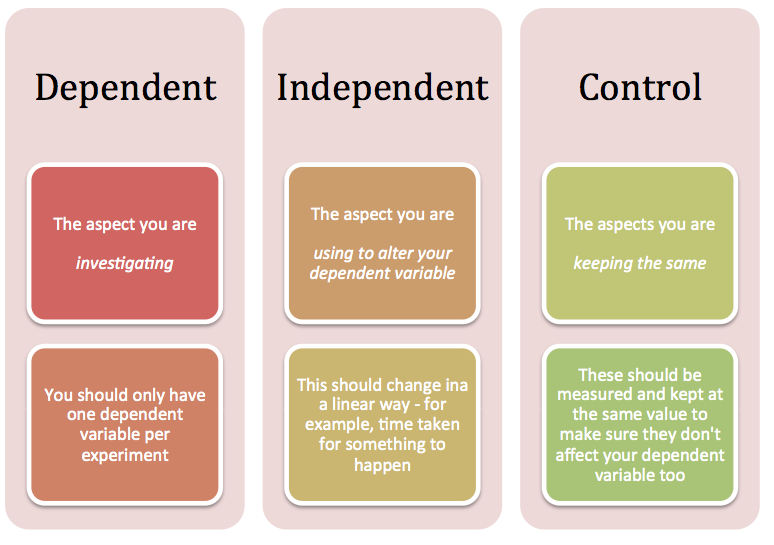
Choosing Your Variables
- Independent variable: something that you change in the experiment. For example, if you are conducting a lab on enzyme activity and how temperature affects the enzymatic activity, the independent variable of the experiment would be temperature as you are going to observe how different temperature could induce different effects on the enzyme activity.
- Dependent variable: the data you are collecting (how will you measure if the IV is working. For example, the rate of the enzymatic reaction would be the dependent variable, because the enzyme activity is influenced by the different temperature.
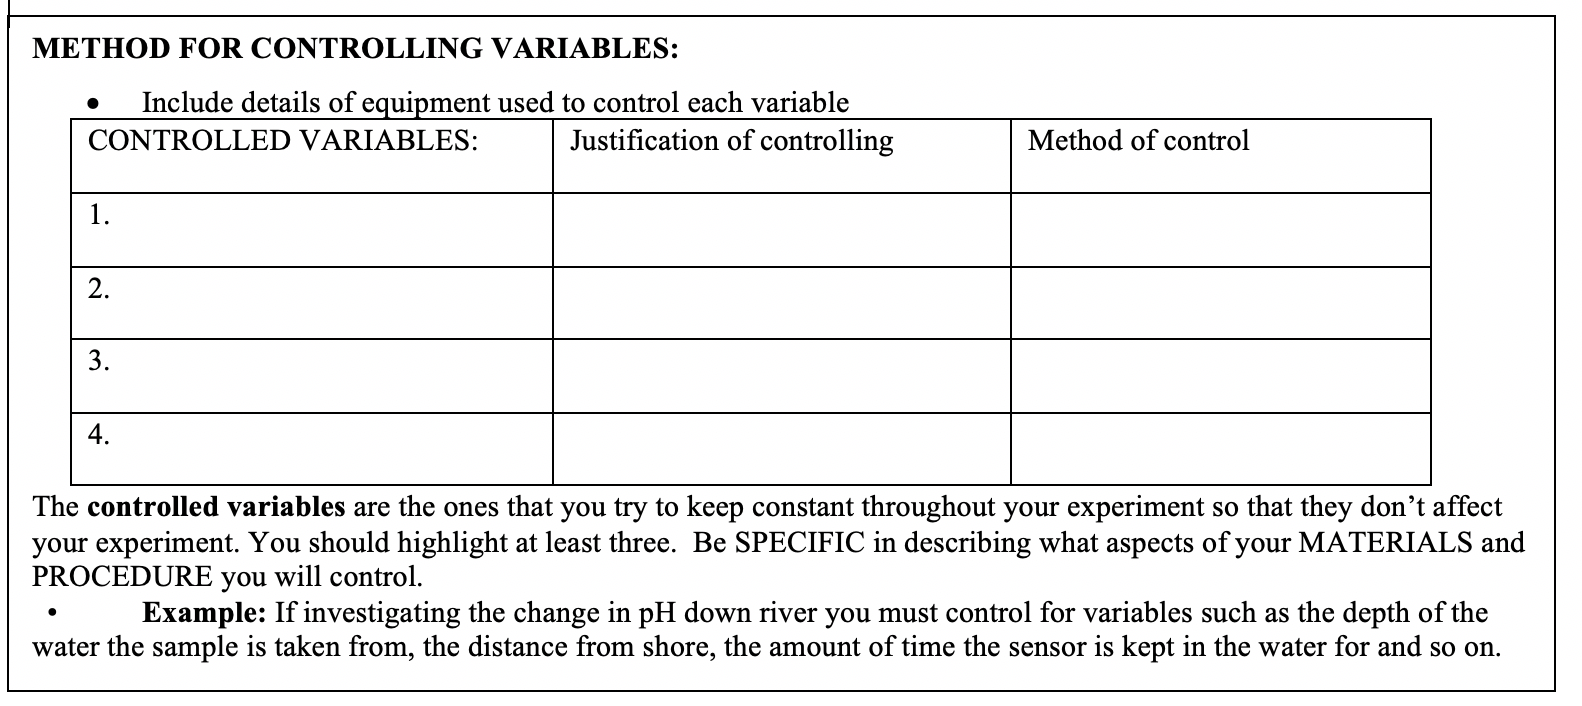
- Controlled variables: variable that needs to be kept constant throughout the experiment. In the enzyme lab, the control variables would be pressure, the amount of the substrate, type of the substrate and etc. It is recommended to list out the variables in the table form as it is easier to see the variables.
- Control Group: Negative and Positive controls for IV
Writing Your Method
What should a method always include?
Useful words: Set up, Measure, Weigh, Pour, Mate, Record, Connect, Join, Calculate, Determine, Read, Locate, Mark, Label, etc...
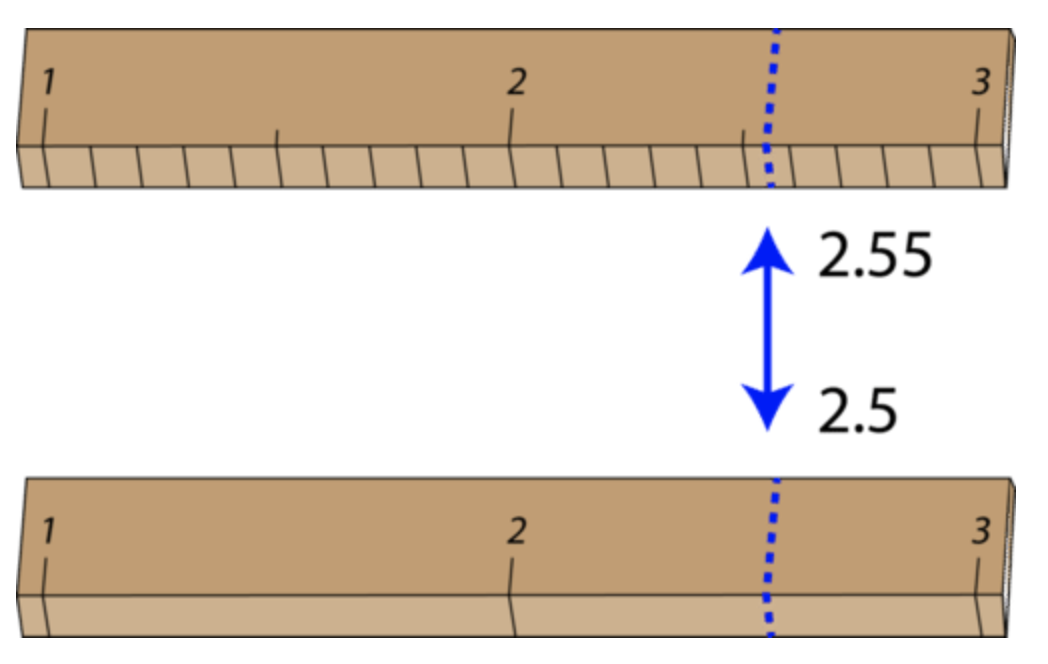
Measuring Uncertainty: all measurements have an element of uncertainty to them. Uncertainty is the range of possible values within which the true value of the measurement lies.
What should a method always include?
- Describe what it is you are trying to do in this investigation. It is good to make a plan that is a step by step guide, so that somebody else could follow it.
- Explain how you will make your measurements precise (control variables)
- Explain how you will make your measurements accurate (control variables)
- State the number of changes in the independent variable that you will make, and explain why you choose these values.
- State the number of times that you intend to repeat your measurements. Explain why you have repeated your measurements.
- Explain how you plan to process you data. What calculations will you carry out that will allow you to know whether your data supports your hypothesis and answers your research question.
- Describe how you will make your experiment safe. Give details of how equipment, procedures and materials will be handled safely
Useful words: Set up, Measure, Weigh, Pour, Mate, Record, Connect, Join, Calculate, Determine, Read, Locate, Mark, Label, etc...
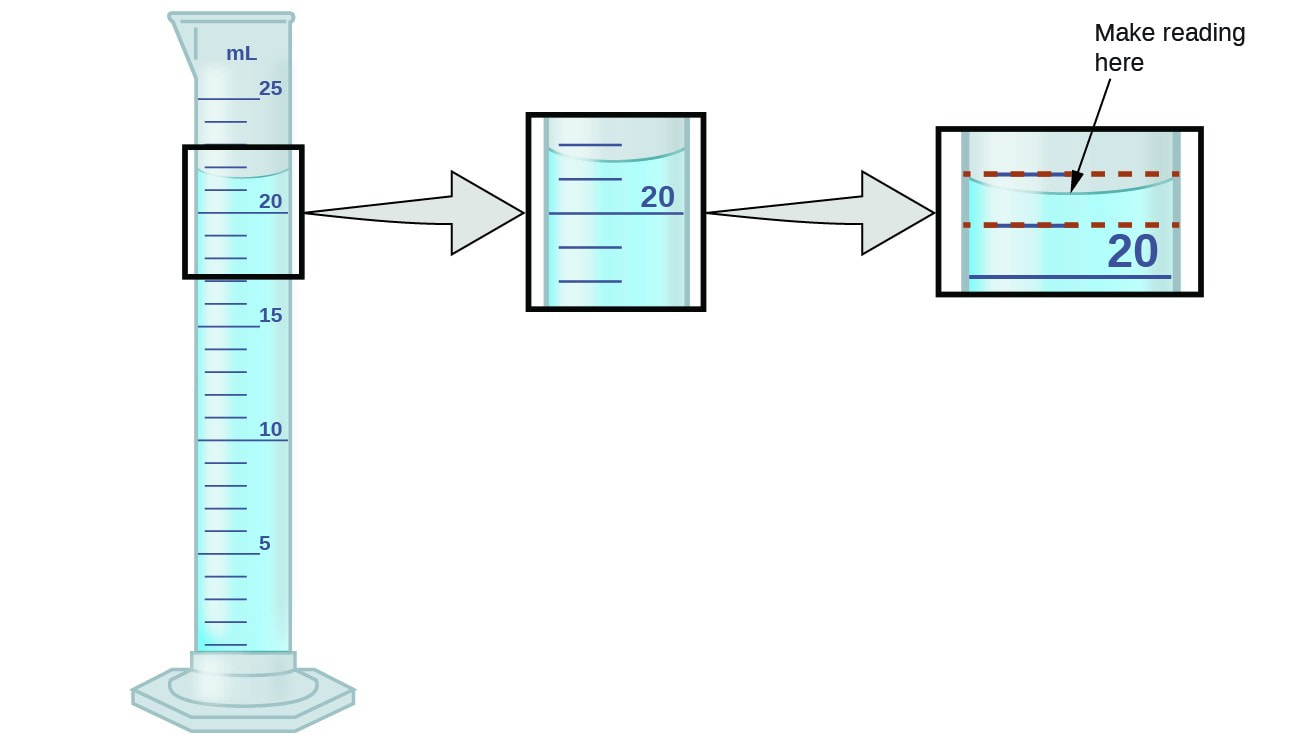
Measuring Uncertainty: all measurements have an element of uncertainty to them. Uncertainty is the range of possible values within which the true value of the measurement lies.
- Calculated: (smallest unit value of instrument/ 2) x by the number of judgements made
- Example: beaker- 25ml between lines, so 25/2= 12.5ml, only one line of judgement so the beakers uncertainty is ±12.5ml
|
|
MYP 4-5 Criteria B Rubric
myp biology criteria c
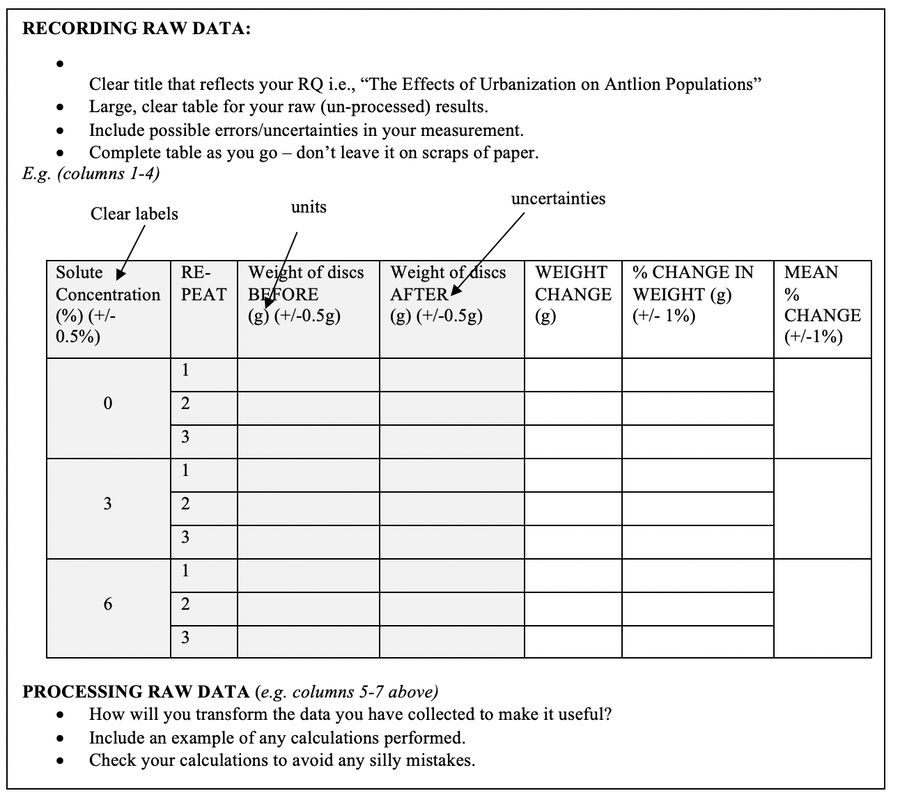
Raw Data
In this section, you will record ALL numbers that you measured during your lab.
Make sure that all tables have;
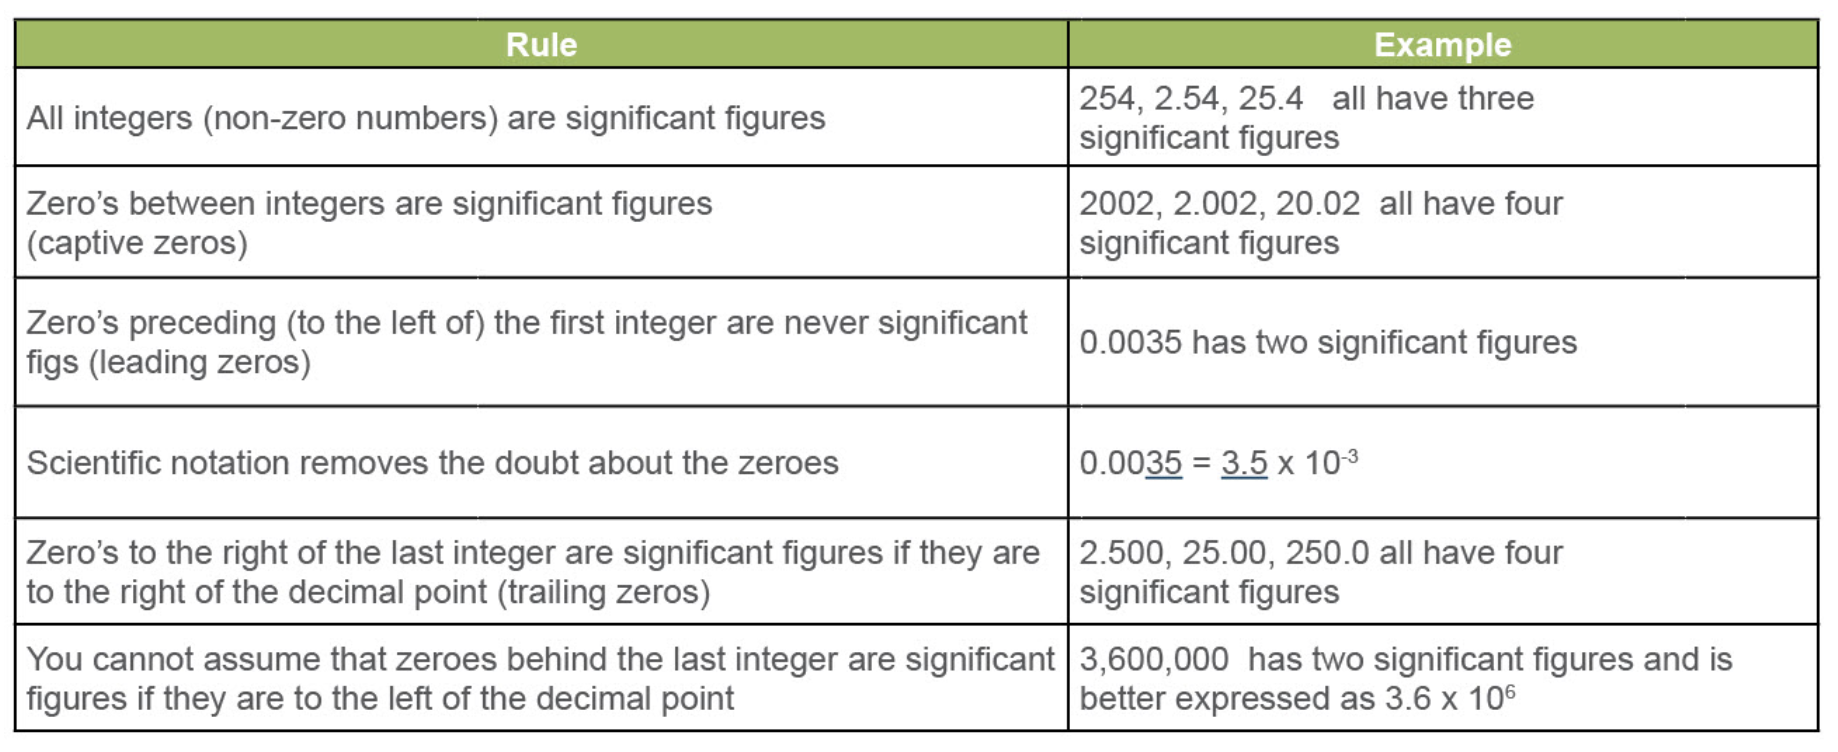
When you collect your measurements, it is necessary to be able to count the number of significant figures. Significant figures in a measurement consist of all the certain digits in that measurement plus one uncertain or estimated digit. It needs to be emphasized that just because a certain digit is not significant does not mean that it is not important or that it can be left out.
In this section, you will record ALL numbers that you measured during your lab.
Make sure that all tables have;
- A heading (title) as appropriate – it should be clear what the data shows. (ie. Table 1:) make sure the title relates to the data you will put in your table. The data table title is NOT a repeat of the research question; the title SHOULD be descriptive of the data contained in the table, i.e. "The Effect of..."
- Column headers IV and DV stating what quantity is displayed in that column, as well as what units are used to measure that quantity. Units should include measurement uncertainties
- Space for trials, averages
- Consistent with significant figures.
- Consider having uncertainties explained
When you collect your measurements, it is necessary to be able to count the number of significant figures. Significant figures in a measurement consist of all the certain digits in that measurement plus one uncertain or estimated digit. It needs to be emphasized that just because a certain digit is not significant does not mean that it is not important or that it can be left out.
Rules for Significant Numbers
Data Presentation and Data Analysis
This section is where you will present any graphs. Graph your processed data (it is almost never appropriate to graph raw data). MOST OF THE TIME graphs should be laid out with the independent variable on the x-axis and the dependent variable on the y-axis. Make sure that each axis has a label stating two things: what quantity is being graphed along that axis, and what units and uncertainty were used to measure that quantity. Also make sure that each axis has an appropriate scale (minimum value, maximum value, space between tick marks). IF APPROPRIATE, add a trend line showing the BEST FIT relationship among your data points. Including slopes, error bars, max-min lines, R^2 values, equations, etc where appropriate
Calculations (e.g. average, range, uncertainty in the dependent variable, calculation of a theoretical value). In biology we represent the uncertainties as a measure of the spread of the data around the average that we call -standard deviation
An appropriate graph (an X-Y scatter graph for continuous data, a Bar chart for discontinuous data) Make sure that all graphs have;
In certain situations you may also carry out other calculations such as correlation to determine whether there is a relationship between two variables.
This section is where you will present any graphs. Graph your processed data (it is almost never appropriate to graph raw data). MOST OF THE TIME graphs should be laid out with the independent variable on the x-axis and the dependent variable on the y-axis. Make sure that each axis has a label stating two things: what quantity is being graphed along that axis, and what units and uncertainty were used to measure that quantity. Also make sure that each axis has an appropriate scale (minimum value, maximum value, space between tick marks). IF APPROPRIATE, add a trend line showing the BEST FIT relationship among your data points. Including slopes, error bars, max-min lines, R^2 values, equations, etc where appropriate
Calculations (e.g. average, range, uncertainty in the dependent variable, calculation of a theoretical value). In biology we represent the uncertainties as a measure of the spread of the data around the average that we call -standard deviation
An appropriate graph (an X-Y scatter graph for continuous data, a Bar chart for discontinuous data) Make sure that all graphs have;
- A title – it should be clear what the graph shows.
- Labels and units where appropriate
- Uncertainties represented as error bars, where appropriate.
- A line of best fit through the uncertainties, where appropriate.
- A line of best fit through the uncertainties, where appropriate. A line of best fit through the uncertainties, where appropriate.
In certain situations you may also carry out other calculations such as correlation to determine whether there is a relationship between two variables.
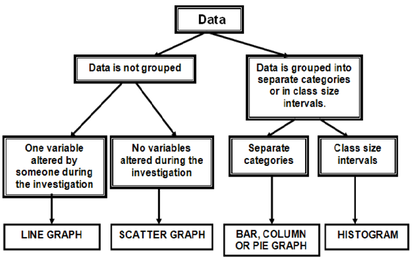
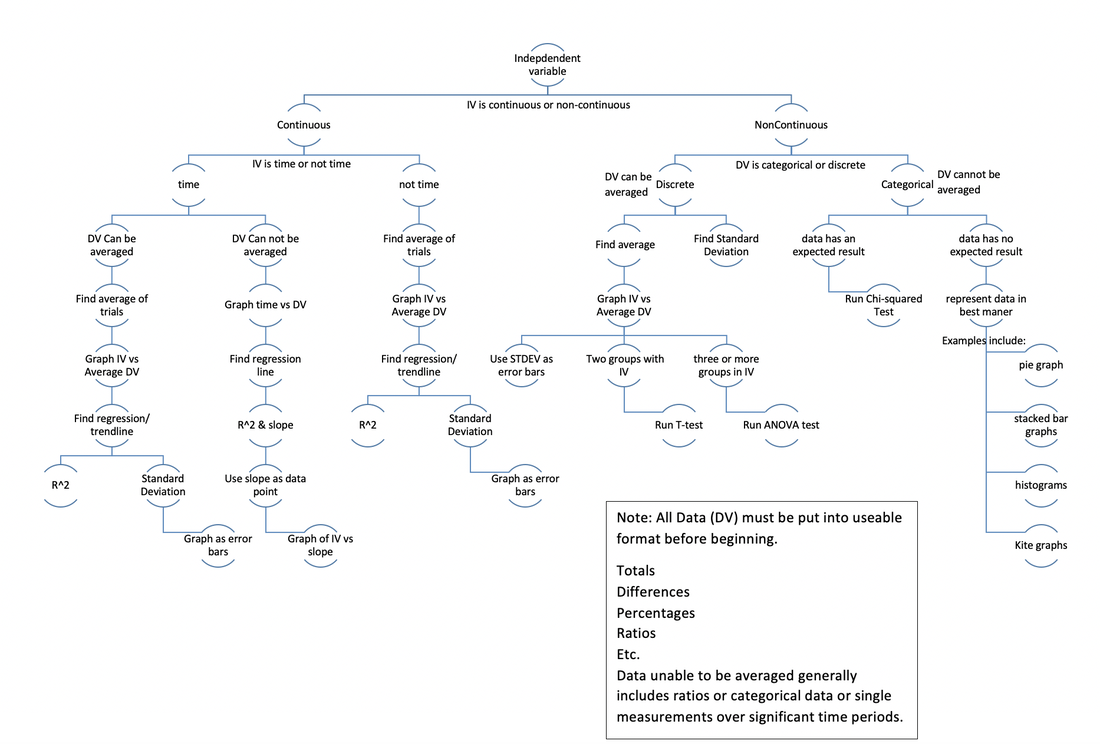
What Type of Graph Do I Use
Data Processing
You need to manipulate or process your raw data (calculations) into a format that will make it more understandable and easier to use. This can include but is not limited to: averages, totals, frequencies, percentages, rates, reciprocals, differences, percent change, etc. This section may be apart of the sections above or below this one. You must include at least one sample calculation of each type used in the report.
You need to manipulate or process your raw data (calculations) into a format that will make it more understandable and easier to use. This can include but is not limited to: averages, totals, frequencies, percentages, rates, reciprocals, differences, percent change, etc. This section may be apart of the sections above or below this one. You must include at least one sample calculation of each type used in the report.
https://msnoller.weebly.com/myp-lab-help.html
How To Do Calculations, Graphs and Statistics
|
|
|
|
|
|
Analysis and Conclusion
Relationship Analysis:
Rate of Change:
Explanation of Tables and Graphs:
Scientific Explanation
Relationship Analysis:
- Determine the nature of the relationship between the independent and dependent variables (e.g., positive or negative correlation).
- Describe any apparent trends or patterns observed in the data.
- Discuss whether the data suggests a linear or non-linear relationship.
Rate of Change:
- Analyze how changes in the independent variable affect the dependent variable.
- If there is a positive correlation, explain how much the dependent variable increases for a unit increase in the independent variable.
- If there is a negative correlation, explain how much the dependent variable decreases for a unit increase in the independent variable.
- If no significant correlation is found, mention that the variables appear to be unrelated
Explanation of Tables and Graphs:
- Provide a brief description of each table and graph, highlighting their purpose in conveying information.
- Mention what each axis of the graph represents and the units of measurement.
- Interpret the significance of any trends or patterns observed in the data.
- Relate the trends to the scientific principles or theories under investigation.
- Discuss the uncertainties associated with your data and calculations.
- Explain how these uncertainties might have affected your results and conclusions.
- If applicable, consider sources of error in the experiment and their potential impact.
Scientific Explanation
- Include scientific reason for your conclusion statement. (Remember to use in-text citation)
- Identify how your data similar or different from other scientists who have done similar investigations (secondary data)
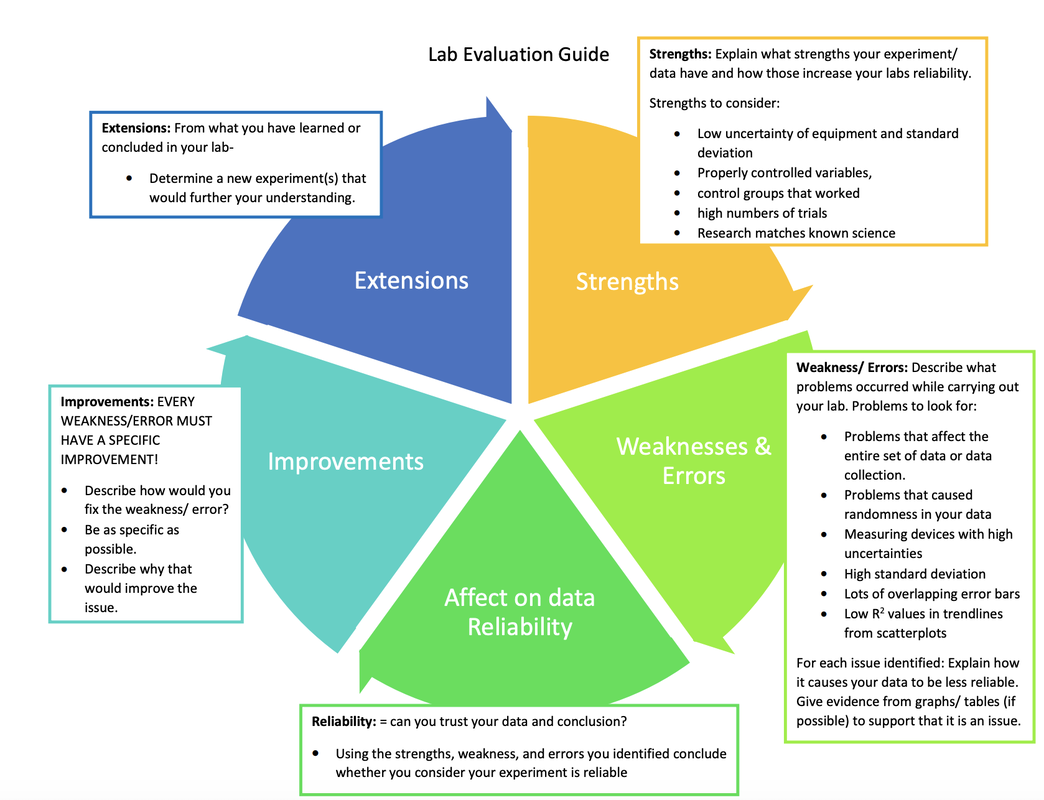
Evaluation
The evaluation is a part where you include both strengths and limitations of the experiment and further suggested experiment that could be conducted.
Validity vs Reliability: Use of statistics, error bars, uncertainty, procedural issues, control variables etc should all be apart of your discussion on whether you can trust your experiment and the data you collected!
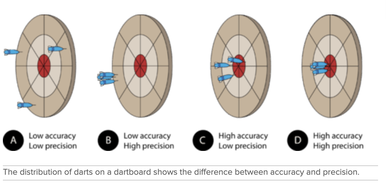
Validity of your experiment: How well did your experiment measure what you were expecting? Ask yourself the following questions: Was my experiment well designed? Did my experiment test what I wanted it to test? How do I know it did this? Does it make your experiment valid or not?
JUDGING VALIDITY
Validity: the judgement that the experiment measured what it was designed measure.
Reliability of Data: how well can you trust your data to be accurate? Usage of error bars and standard deviation can indicate consistency or inconsistency in data. Trial similarity can also indicate this. Ask yourself the following questions: What errors affected my lab? How did those errors affect my lab?
**Make sure the errors discussed are directly related to how they affected the data and how did they reduce the reliability of the data.
The evaluation is a part where you include both strengths and limitations of the experiment and further suggested experiment that could be conducted.
Validity vs Reliability: Use of statistics, error bars, uncertainty, procedural issues, control variables etc should all be apart of your discussion on whether you can trust your experiment and the data you collected!
Validity of your experiment: How well did your experiment measure what you were expecting? Ask yourself the following questions: Was my experiment well designed? Did my experiment test what I wanted it to test? How do I know it did this? Does it make your experiment valid or not?
JUDGING VALIDITY
Validity: the judgement that the experiment measured what it was designed measure.
- Validity is a lot harder to judge.
- Comparison of your conclusion to another lab that did something similar (if possible) can help you determine this
- Control variables that should have been controlled but were left out, these can affect validity
Reliability of Data: how well can you trust your data to be accurate? Usage of error bars and standard deviation can indicate consistency or inconsistency in data. Trial similarity can also indicate this. Ask yourself the following questions: What errors affected my lab? How did those errors affect my lab?
**Make sure the errors discussed are directly related to how they affected the data and how did they reduce the reliability of the data.
Using Error Bars
- The length of an Error Bar helps reveal the uncertainty of a data point: a short Error Bar shows that values are concentrated, signalling that the plotted average value is more likely, while a long Error Bar would indicate that the values are more spread out and less reliable
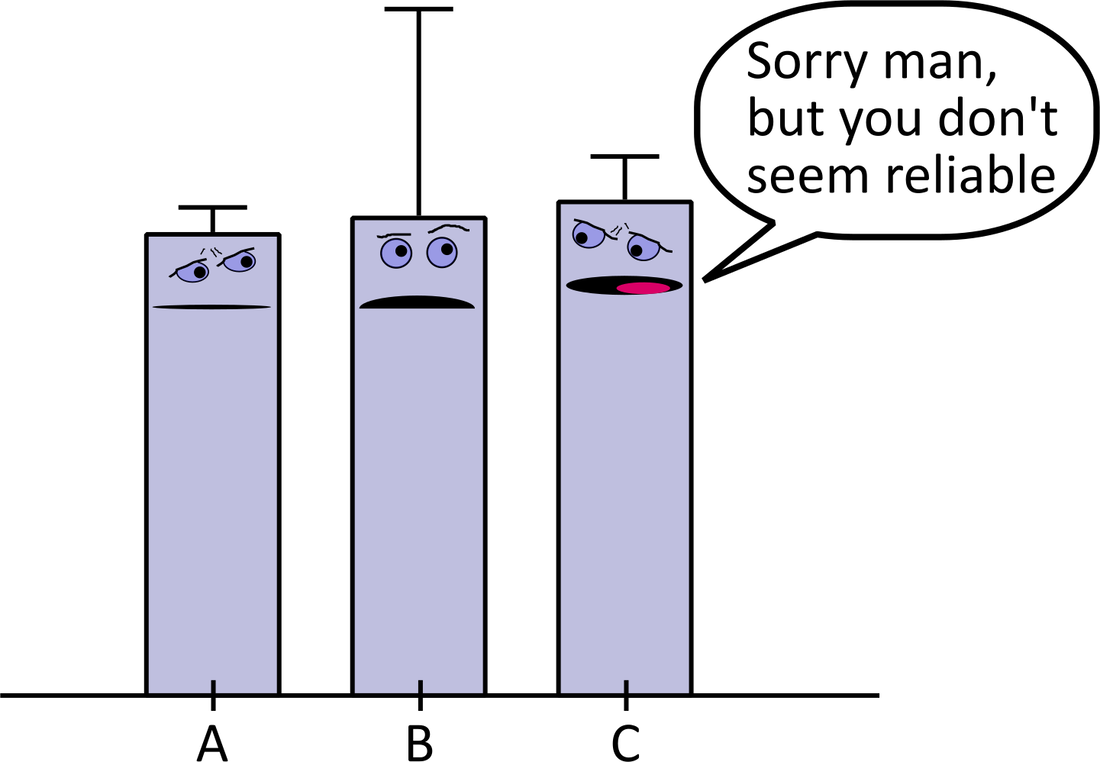
EVALUATING UNCERTAINTY: The greater the uncertainty the more unreliable your data is, as your measurements are mostly likely not accurate.
- Generally NOT a good source of error.
- Assumed that you choose the BEST equipment to minimize this error during lab. Note: This is not calculated uncertainty, simply measurement uncertainty!
Standard Deviation (used only when calculated average)
- Measurement of how close your data is to the mean/ average
- The greater the variation in your data the more unreliable your data is
- Can be represented by error bars on a graph
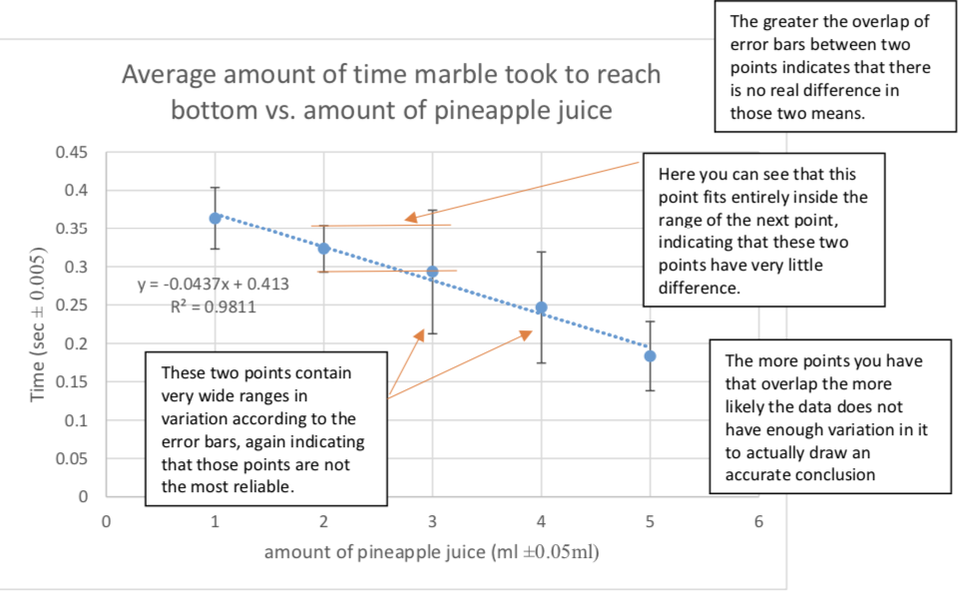
EVALUATING STANDARD DEVIATION: While the above graph actually has a very good trendline, the error indicated with the standard deviation demonstrates the unreliability of the data. So while a good conclusion as to the trend can be gathered the author of this report would indicate that the data is actually very unreliable.
Additionally, Not collecting enough data can make a lab unreliable as well.
Additionally, Not collecting enough data can make a lab unreliable as well.
Linear Regression Lines (for scatter plots)
- On a scatter plot create a best fit line (a line that gives the general trend of the data)
- With the best fit line comes an R2 value = measurement of how close your line fits your data
- The closer the number is to 1 the better the fit, and more valid the conclusion about the trend is.
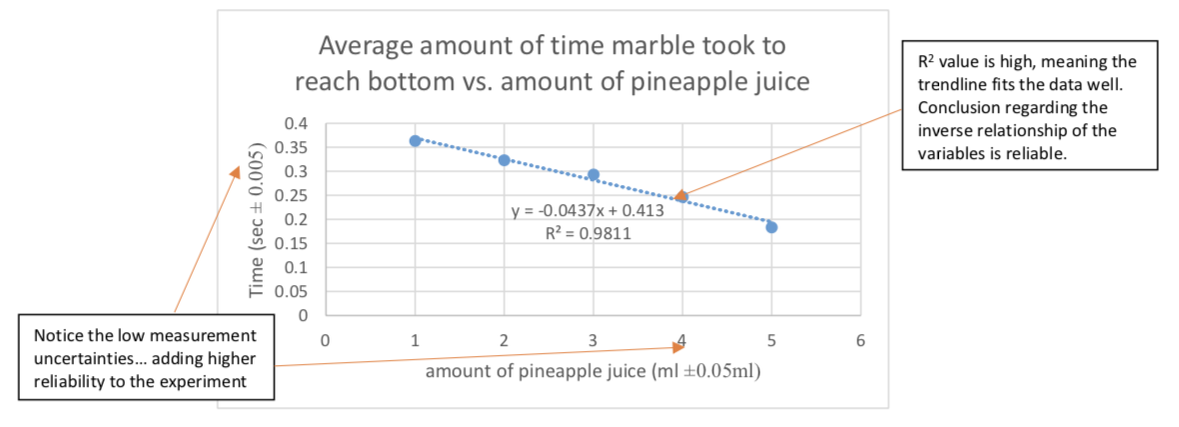
EVALUATING TRENDLINES and R2: The closer R2 is to 1, the more likely the pattern seen in the graph matches the data. This indicates the method and data are fairly reliable, and your conclusion should also be reliable.
Errors: Errors or issues identified above need to
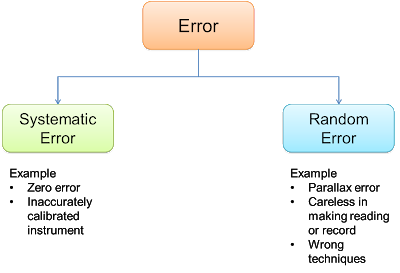
Error can be defined into two categories.
- It should also explain the errors that affect the validity and reliability.
- EVERY error needs an EXPLANATION and an IMPROVEMENT!
Error can be defined into two categories.
- Systematic Errors: Affects all data in one direction (ex. calibration errors, methodology or procedural errors, etc)
- Random Errors: Affect one data point (ex. human error, misreading instrument, malfunctioning equipment, etc.)
http://spmphysics.onlinetuition.com.my/2013/06/measurement-and-error.html
EXTENSION: Ask yourself: What could you do to further your research? What would be interesting to investigate that would expand on what you learned here? What variables could you change? How could you make it more realistic for the real world?
https://msnoller.weebly.com/myp-lab-help.html
Bibliography
- Should contain all sources referenced in your report.
- Should follow a conventional method (MLA, APA, or Chicago). Make sure your report contains in-text citations where you referenced information.
- Citations should be alphabetical.
- Any non-English sources used should be referenced in their actual language and then translated into English.
MYP 4-5 Criteria C Rubric
Extra Help Here -
MYP Templates Planners
MYP Templates Planners
|
|
|
Sentence Starters
|
|
|
Exemplars
|
|
|
|
|
|
