topic 4.1: Introduction to Water Systems
 Image from goodmenproject.com
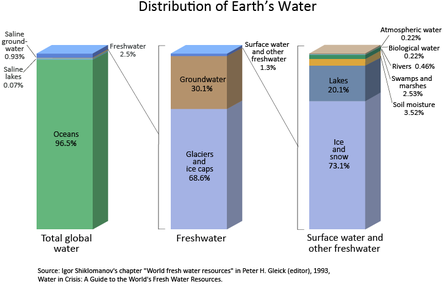
Only a small fraction (2.6% by volume) of the Earth’s water supply is fresh water. Of this, over 80% is in the form of ice caps and glaciers, 0.6% is groundwater and the rest is made up of lakes, soil water, atmospheric water vapour, rivers and biota in decreasing order of storage size.
Irrigation, industrialization and population increase all make demands on the supplies of fresh water. Global warming may disrupt rainfall patterns and water supplies. The hydrological cycle supplies humans with fresh water but we are withdrawing water from underground aquifers and degrading it with wastes at a greater rate than it can be replenished.
In this unit we will look at the increased demand for fresh water, inequity of usage and political consequences, methods of reducing use and increasing supplies. This unit is 3 hours.
Significant ideas:
- The hydrological cycle is a system of water flows and storage that may be disrupted by human activity
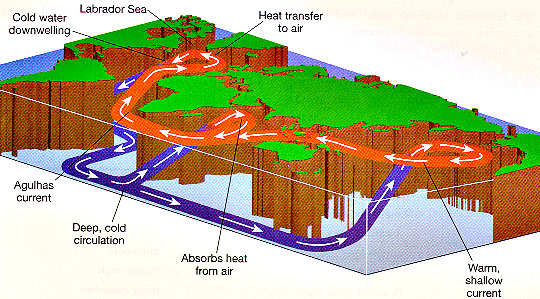
- The ocean circulation system (ocean conveyor belt) influences the climate and global distribution of water (matter and energy)
Big questions:
- What strengths and weaknesses of the systems approach and the use of models have been revealed through this topic?
- To what extent have the solutions emerging from this topic been directed at preventing environmental impacts, limiting the extent of the environmental impacts, or restoring systems in which environmental impacts have already occurred?
- How are the issues addressed in this topic of relevance to sustainability or sustainable development?
- In what ways might the solutions explored in this topic alter your predictions for the state of human societies and the biosphere some decades from now?
- Many hydrological cycles cross international boundaries. How does this affect the management of water?
- Identify the solutions to the impacts of agriculture, deforestation and urbanization on the hydrological cycle
- Can agriculture, deforestation and urbanization allow for the natural functioning of the hydrological cycle?
- In what ways may population growth and human activities have an impact on the hydrological cycle of the future?
Knowledge and Understanding
4.1.U1 Solar radiation drives the hydrological cycle
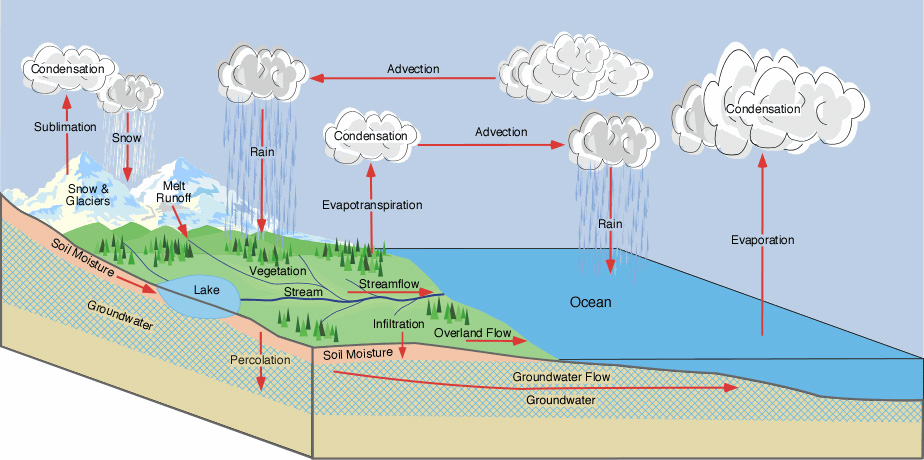
- Draw an annotated systems diagram of the hydrological cycle
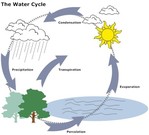
Earth's water is in constant motion as water at the surface exchanges places with the gaseous moisture and water droplets found in the atmosphere. As the sun warms the Earth, liquid water found in lakes and oceans on the planet's surface evaporates. Moisture within the atmosphere eventually cools and condenses, until liquid water or snow falls back to the Earth as precipitation. Runoff from rain eventually finds its way back to lakes and oceans, completing the most direct version of the water cycle.
The water cycle is able to move 495,000 cubic kilometers of moisture through the atmosphere each year. Without the sun's heat, there would be no evaporation to power the cycle. The heat of the sun is responsible for the formation of clouds and weather patterns. Without heat from the sun to drive the water cycle, there could be no weather, and all of Earth's water would exist in a frozen state
The water cycle is able to move 495,000 cubic kilometers of moisture through the atmosphere each year. Without the sun's heat, there would be no evaporation to power the cycle. The heat of the sun is responsible for the formation of clouds and weather patterns. Without heat from the sun to drive the water cycle, there could be no weather, and all of Earth's water would exist in a frozen state
4.1.U2 Fresh water makes up only a small fraction (approximately 2.6% by volume) of the Earth's water storages
- Outline the amount of freshwater that is part of the Earth’s water storages
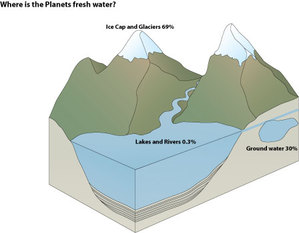
Only a small fraction (2.6% by volume) of the Earth’s water supply is fresh water. Of this, over 80% is in the form of ice caps and glaciers, 0.6% is groundwater and the rest is made up of lakes, soil water, atmospheric water vapour, rivers and biota in decreasing order of storage size. Precise figures are not required.
The degree to which water can be looked at as renewable or non-renewable depends on where it is found in the hydrological cycle. Renewable water resources are renewed yearly or even more frequently, however groundwater is non-renewable resource
The degree to which water can be looked at as renewable or non-renewable depends on where it is found in the hydrological cycle. Renewable water resources are renewed yearly or even more frequently, however groundwater is non-renewable resource
4.1.U3 Storage's in the hydrological cycle include organisms, soil and various water bodies, including oceans, groundwater (aquifers), lakes, rivers, atmosphere, glaciers and ice caps
- Describe the storages within the hydrological cycle.
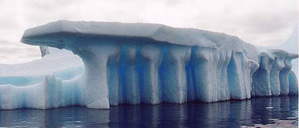
The water cycle is dynamic and always active, but that doesn’t mean every molecule of water is constantly moving through the system. In fact, water is stored in various parts of the cycle, often referred to as reservoirs. These might be as large as water in the oceans, or, on a smaller scale, water can be ‘trapped’ in an iceberg or a lake. Much more water is in storage than actively moving through the water cycle.
How long water spends in each reservoir is called ‘residence time’. These are some estimated average residence times, but it’s important to remember that some water will spend much longer or shorter time than this.
How long water spends in each reservoir is called ‘residence time’. These are some estimated average residence times, but it’s important to remember that some water will spend much longer or shorter time than this.
4.1.U4 Flows in the hydrological cycle include evaporation, sublimation, evaporation, condensation, convection (wind-blown movement), precipitation, melting, freezing, flooding, surface runoff, infiltration, percolation, and stream-flow or currents
- Distinguish between transformation flows and transfer flows within the hydrological cycle.

As water moves through the cycle, it changes state from liquid (rainwater, seawater) to gas (water vapour) and back to liquid. Liquid can also freeze and become solid (ice or snow). This natural process removes some of the water’s impurities, constantly refilling Earth’s fresh water supplies – it is our planet’s way of recycling water.
- Evaporansportation - water evaporates from plants, mainly through their leaves. This gets water vapor back into the air.
- Sublimation - the conversion between the solid and the gaseous phases of matter, with no intermediate liquid stage. Used to describe the process of snow and ice changing into water vapor in the air without first melting into water.
- Evaporation - the process of changing water from liquid to gas. Only fresh water makes its way up to the clouds, as ocean water leaves behind salt, minerals and metals when it evaporates.
- Condensation - the process of changing water from gas to liquid.. As water vapour rises, it becomes cooler and changes back into tiny liquid water droplets. These merge together to form clouds.
- Advection - Transport of an atmospheric property by the wind. This horizontal transport or transfer of a quality such as heat and cold from one point to another. Advective transfers occur either in the oceans by currents of seawater or by large-scale movement in the atmosphere where humidity (atmospheric moisture) is another important property. In both cases a major example is the transport of cold air or water masses from the polar regions to lower latitudes.
- Precipitation - when rain, snow, sleet or hail falls from the sky. Depending on the air temperature, water can take a liquid form (rain), or a solid form (snow, sleet or hail).
- Melting - the process by which ice or snow changes into water
- Freezing - the process by which water changes from liquid to solid
4.1.U5 Human activities such as agriculture, deforestation and irrigation have a significant impact on surface runoff and infiltration
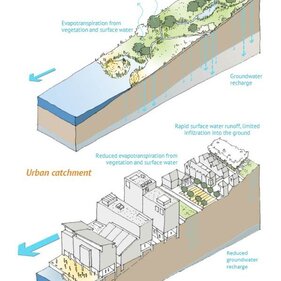
- Outline the impacts of each of these human activities can have on surface runoff and infiltration: Agriculture, Deforestation and Urbanization
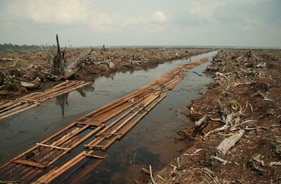 image from en.wikipedia.org
Agriculture has been the cause of significant modification of landscapes throughout the world. Tillage of land changes the infiltration and runoff characteristics of the land surface, which affects recharge to ground water, delivery of water and sediment to surface-water bodies, and evapotranspiration. All of these processes either directly or indirectly affect the interaction of ground water and surface water
Applications of pesticides and fertilizers to cropland can result in significant additions of contaminants to water resources. Some pesticides are only slightly soluble in water and may attach to soil particles instead of remaining in solution; these compounds are less likely to cause contamination of ground water. Other pesticides, however, are detected in low, but significant, concentrations in both ground water and surface water
Point sources of contamination to surface-water bodies are an expected side effect of urban development.Point sources of contamination to ground water can include septic tanks, fluid storage tanks, landfills, and industrial lagoons. If a contaminant is soluble in water and reaches the water table, the contaminant will be transported by the slowly moving ground water. If the source continues to supply the contaminant over a period of time,
Deforestation leads to the decreasing of interception and infiltration, because there are not trees to trap rainfall. It is easily to increase the amount of surface runoff and increase the storm runoff in rivers. The erosive power is enhanced by the running water. Because there are few trees, lesser roots of vegetation bind the soil particles. This makes to the increase of soil erosion. Moreover, sediment yields in rivers increase. The river is silted up. Finally, the river is risk to be flooded. This is the result of the raise of riverbed and reducing carrying capacity of the channel.
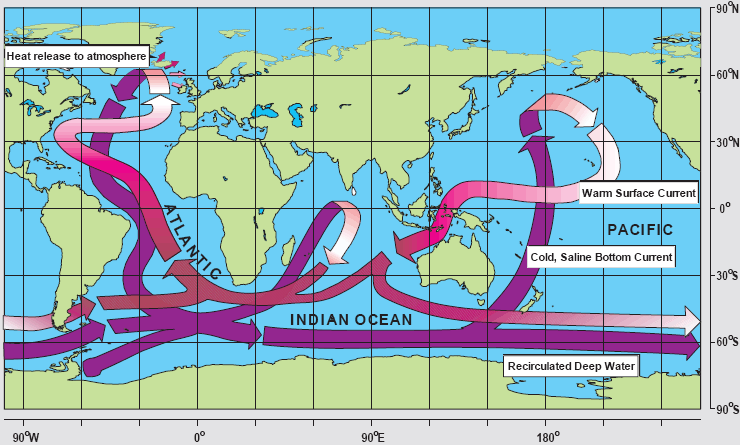
4.1.U6 Ocean circulation systems are driven by differences in temperature and salinity. The resulting difference in water density drives the ocean conveyor belt, which distributes heat round the world, and thus affects climate
- Explain the key factors that drive the global ocean conveyor belt.
- Outline how the global conveyor belt distributes heat around the world and affects weather.
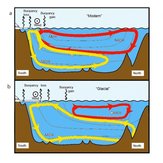 image from www.sciencedaily.com
Mass flows of water, or currents, are essential to understanding how heat energy moves between the Earth’s water bodies, landmasses, and atmosphere. The ocean covers 71 percent of the planet and holds 97 percent of its water, making the ocean a key factor in the storage and transfer of heat energy across the globe. The movement of this heat through local and global ocean currents affects the regulation of local weather conditions and temperature extremes, stabilization of global climate patterns, cycling of gases, and delivery of nutrients and larva to marine ecosystems
Application and skills
4.1.A1 Discuss human impact on the hydrological cycle
[The effect of urbanization on water flows and potential of flash floods should be covered.]
[The effect of urbanization on water flows and potential of flash floods should be covered.]
- Explain how urbanization can lead to flash floods and how sustainable urban drainage systems can alleviate the problem.
Irrigation, industrialization and population increase all make demands on the supplies of fresh water. Global warming may disrupt rainfall patterns and water supplies. The hydrological cycle supplies humans with fresh water but we are withdrawing water from underground aquifers and degrading it with wastes at a greater rate than it can be replenished.
Consider the increased demand for fresh water, inequity of usage and political consequences, methods of reducing use and increasing supplies. A case study must be explored that covers some of these issues and demonstrates either sustainable or unsustainable water use.
The demand of water has increased in both MEDCs and LEDCs, as populations are increasing as well as agriculture changing and expanding industry. MEDCs need more water as they wash more often, water their gardens, and wash their cars.
Managing water
This can be reached by:
- making new buildings water efficient (rainwater for sanitation and showers)
- fitting new homes with more water-efficient appliances (dishwashers and toilets)
- expand metering to encourage households to use water more efficiently
- in some rural areas drought resistant crops should be planted to reduce the need for irrigation
- organic fertilizers cause less pollution and bio-control measures can be used to reduce crop pests
CASE STUDY
Water shortages in Southwest United States:
Resource managers in the Colorado River Basin are preparing for an unprecedented scenario: By 2015, water in Lake Powell is likely to drop to a level that will trigger mandatory cuts in water deliveries to California, Arizona and Nevada.
About 36 million people in seven states and 20 Native American nations rely on Colorado River water, which is collected in reservoirs like Lake Powell. In addition, diversions from the river irrigate 4 million acres of land, producing about 15 percent of the nation's crops. Water deliveries to California, Arizona and Nevada would be cut by 750,000 acre-feet — about 244,500,000,000 gallons of water. An acre-foot of water is about 325,853 gallons, equal to the average annual household use in the U.S.
If farmers in Arizona and Southern California have to find more expensive replacement water, it would affect food prices across the country.
4.1.S1 Construct and analyse a hydrological cycle diagram
Key Terms
|
haline
surface water hydrology rivers advection salinization irrigation evaporation evapotranspiration |
salt water
thermohaline soil moisture hydroelectric hydrologic cycle consumptive water condensation upwelling |
fresh water
aquifer drought la nina watershed freezing melting |
ground water
ponds nitrates el nino zone of saturation watershed management transpiration |
turnover time
lakes water table recharge zone salinization heat capacity downwelling |
Classroom Materials
Water Cycle Diagram worksheet
Global Water Use
Home Water Use activity
Calculate Your Water Footprint
Practice Problems: Estimating Water Budgets
Bottle Water Case Study
Map of Worldwide Domestic Water Use - World Mapper
World Map of Industrial Water Use - World Mapper
World Map of Agricultural Water Use Map - World Mapper
Map Worldwide Poor Water Quality - World Mapper
Map of Worldwide Water Availability - World Mapper
Map of Worldwise Water Depletion - World Mapper
Case Studies
- One detailed example of human influence on the hydrological cycle with regards to agriculture, deforestation and/or urbanization (eg. the Colorado River and agriculture)
Powerpoint and Notes Adapted from Brad Kremer, P Brooks and Ms. McCrindle
Your browser does not support viewing this document. Click here to download the document.
Your browser does not support viewing this document. Click here to download the document.
Correct use of terminology is a key skill in ESS. It is essential to use key terms correctly when communicating your understanding, particularly in assessments. Use the quizlet flashcards or other tools such as learn, scatter, space race, speller and test to help you master the vocabulary.
Useful Links
Topic 4.1, 4,2, 4,3 Water Systems - NicheScience
Interactive Tool Looking at the Path of a Raindrop in the United States
Interactive Tool Looking At Water Availability and Usage Around the World
Characteristics of Water - Sumanis
USGS Water
Aerial Photos of Water
Water Use Statistics how much water is being consumed in the world this year - WorldOMeter
Cost of Removing Nitrates from Ground water - Essex University
Water and Development - Global Issues
Water Cycle animation - Earthguide
Water Cycle - McGraw Hill
Water Consumption Calculator - CSG Network
How Much Is Your Daily Indoor Water Use - USGS
Water Use Calculator - Water Budgets
Water Footprint Calculator - Grace
Ground Water Animation - TechAlive
In The News
MAP: The World's Water Scarcity Problem Is Bad And Getting Worse - Business Insider May 13, 2014
Freshwater Stories - National Geographic
Water - NPR Science Friday Podcast 21 Mar 2008
International-mindedness
- Many hydrological cycles are shared by various nations. This can lead to international disputes.
TOK
- The hydrological cycle is represented as a systems model—to what extent can systems diagrams effectively model reality, given that they are only based on limited observable features?
Video Clips
Julia Roberts, Harrison Ford, Kevin Spacey, Edward Norton, Penélope Cruz, Robert Redford and Ian Somerhalder all join forces to give nature a voice.
Fresh water accounts for only 2.5% of Earth's water, yet it is vital for human civilization. What are our sources of fresh water? In the first of a two part series on fresh water, Christiana Z. Peppard breaks the numbers down and discusses who is using it and to what ends.
Hank again on cycles. Focus on Hydrological Cycle
In this video Paul Andersen explains the vital role that water plays in the processes on the Earth's surface. Water has several unique properties including high heat capacity, transparency, polarity and the ability to change the chemical behavior of the mantle. The Earth is largely a water planet but most of the water is found in the oceans or locked in ice. Water is a powerful erosive force on the planet.
The Story of Bottled Water, released on March 22, 2010 (World Water Day) employs the Story of Stuff style to tell the story of manufactured demand—how you get Americans to buy more than half a billion bottles of water every week when it already flows from the tap. Over five minutes, the film explores the bottled water industrys attacks on tap water and its use of seductive, environmental-themed advertising to cover up the mountains of plastic waste it produces
Water is the fundamental ingredient for life on Earth. Looking at our Earth from space, with its vast and deep ocean, it appears as though there is an abundance of water for our use. However, only a small portion of Earth's water is accessible for our needs. How much fresh water exists and where it is stored affects us all. This animation uses Earth science data from a variety of sensors on NASA Earth observing satellites as well as cartoons to describe Earth's water cycle and the continuous movement of water on, above and below the surface of the Eart
This video uses animation, graphics, and video clips to illustrate and explain each of the "flow" and "storage" processes in the Hydrologic Cycle, more commonly known as the Water Cycle: precipitation, interception, runoff, infiltration, percolation, groundwater discharge, evaporation, transpiration, evapotranspiration, and condensation.
Forests cover about 30% of the planet, but deforestation is clearing these essential habitats on a massive scale. This can have devastating effects on the hydrological cycle
Deforestation is a concerning issue today. In this video we explore the affects it has on the water cycle & climate change.
Water. It's an essential building block of life, constantly moving in a hydrologic cycle that flows in a continuous loop above, across and even below the Earth's surface. But water is also constantly moving through another cycle -- the human water cycle -- that powers our homes, hydrates our bodies, irrigates our crops and processes our waste. The tight connection between water, food and energy makes them dependent on one another.
The short animation called "Ever wondered where the rain goes?" demonstrates how changes to the natural water cycle caused by development can be positively managed, and, how SuDS turns this challenge into an exciting opportunity contributing to better places.
The oceans are mostly composed of warm salty water near the surface over cold, less salty water in the ocean depths. These two regions don't mix except in certain special areas. The ocean currents, the movement of the ocean in the surface layer, are driven mostly by the wind. In certain areas near the polar oceans, the colder surface water also gets saltier due to evaporation or sea ice formation.
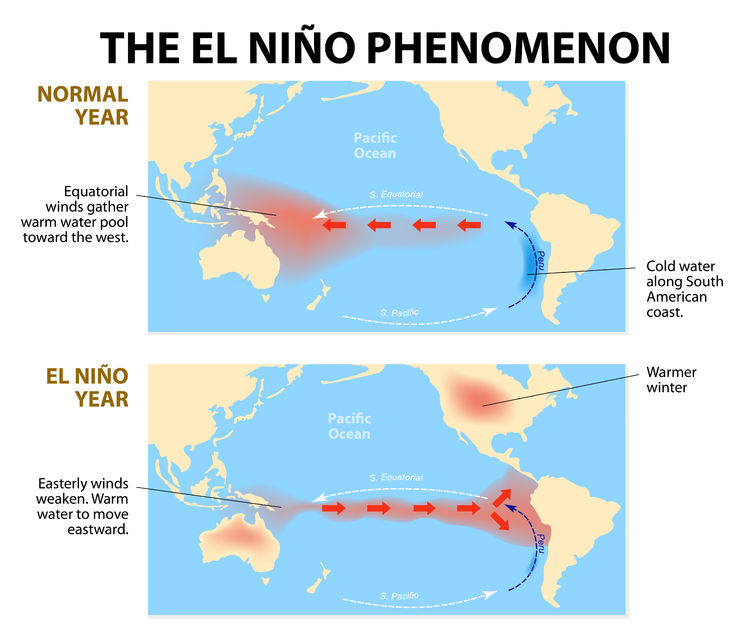
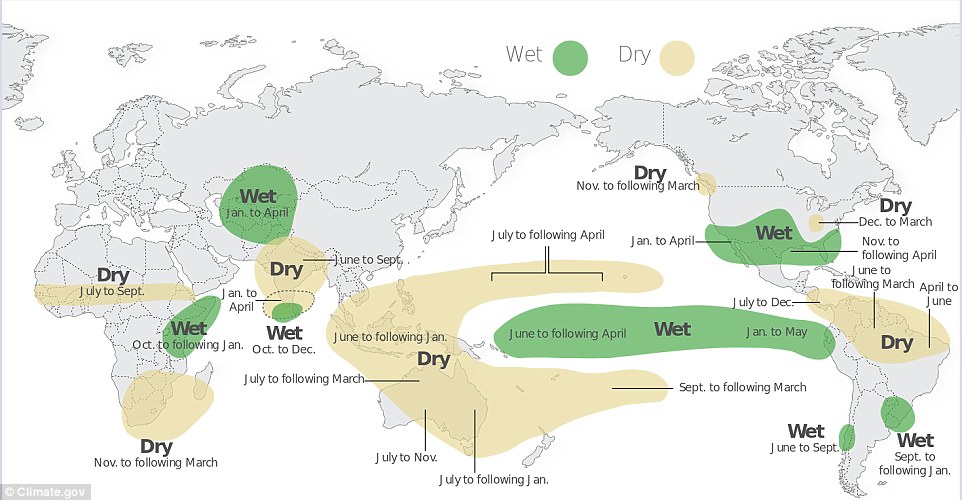
Have you ever wondered what El Niño is? Trace was curious and decided to do some digging to figure out what exactly it is.
Human Impact on Water
