Statistical analysis
 image from unstats.un.org
Statistical Analysis is used to calculate mean and standard deviation, t-Test, and correlation between data sets. We do not cover this as a specific unit, however, the information will be incorporated into our curriculum as well your Internal Assessments. This information has been modified from the old IB Biology curriculum.
Correlation and Causation
One of the most common errors we find is the confusion between correlation and causation in science. In theory, these are easy to distinguish — an action or occurrence can cause another (such as smoking causes lung cancer), or it can correlate with another (such as smoking is correlated with alcoholism). If one action causes another, then they are most certainly correlated. But just because two things occur together does not mean that one caused the other, even if it seems to make sense.
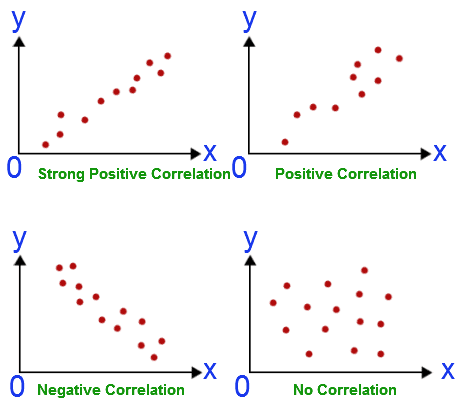
Correlation describes the strength and direction of a linear relationship between two variables
Is positive (x = y) or negative (x = - y)
Causation describes the relationship between two variables, where one variable has a direct effect on another
Correlation does not automatically indicate causation – just because two variables change in relation to one another, does not mean they are linked
E.g. CO2 levels and crime have both risen, but CO2 levels don't cause crime
Mean
The sum of all the data points divided by the number of data points.
Measure of central tendency for normally distributed data.
DO NOT calculate a mean from values that are already averages.
DO NOT calculate a mean when the measurement scale is not linear (i.e. pH units are not measured on a linear scale
Measure of central tendency for normally distributed data.
DO NOT calculate a mean from values that are already averages.
DO NOT calculate a mean when the measurement scale is not linear (i.e. pH units are not measured on a linear scale
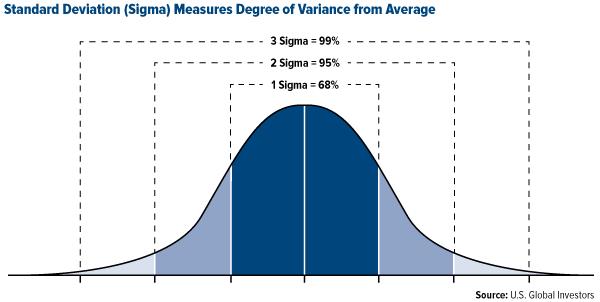
Standard Deviation
Averages do not tell us everything about a sample. Samples can be very uniform with the data all bunched around the mean or they can be spread out a long way from the mean. The statistic that measures this spread is called the standard deviation. The wider the spread of scores, the larger the standard deviation. For data that has a normal distribution, 68% of the data lies within one standard deviation of the mean

How to Calculate the Standard Deviation:
- Calculate the mean (x̅) of a set of data
- Subtract the mean from each point of data to determine (x-x̅). You'll do this for each data point, so you'll have multiple (x-x̅).
- Square each of the resulting numbers to determine (x-x̅)^2. As in step 2, you'll do this for each data point, so you'll have multiple (x-x̅)^2.
- Add the values from the previous step together to get ∑(x-x̅)^2. Now you should be working with a single value.
- Calculate (n-1) by subtracting 1 from your sample size. Your sample size is the total number of data points you collected.
- Divide the answer from step 4 by the answer from step 5
- Calculate the square root of your previous answer to determine the standard deviation.
- Be sure your standard deviation has the same number of units as your raw data, so you may need to round your answer.
- The standard deviation should have the same unit as the raw data you collected. For example, SD = +/- 0.5 cm.
Student t-Test
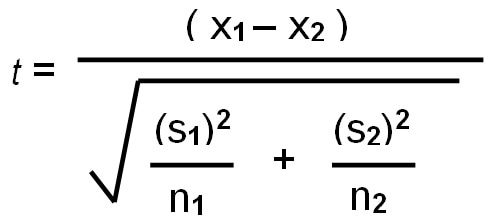
The Student’s t-test is a statistical test that compares the mean and standard deviation of two samples to see if there is a significant difference between them. In an experiment, a t-test might be used to calculate whether or not differences seen between the control and each experimental group are a factor of the manipulated variable or simply the result of chance.
The T-test is a test of a statistical significant difference between two groups. A "significant difference" means that the results that are seen are most likely not due to chance or sampling error. In any experiment or observation that involves sampling from a population, there is always the possibility that an observed effect would have occurred due to sampling error alone. But if result is "significant," then the investigator may conclude that the observed effect actually reflects the characteristics of the population rather than just sampling error or chance.
In any significance test, there are two possible hypothesis:
|
Null Hypothesis:
"There is not a significant difference between the two groups; any observed differences may be due to chance and sampling error." |
Alternative Hypothesis:
"There is a significant difference between the two groups; the observed differences are most likely not due to chance or sampling error." |
|
Where:
x1 is the mean of sample 1 s1 is the standard deviation of sample 1 n1 is the sample size of sample 1 x2 is the mean of sample 2 s2 is the standard deviation of sample 2 n2 is the sample size in sample 2 |
|
How to calculate T:
A p-value s the probability of concluding there is a significant difference between the groups result when the null hypothesis is true (meaning, the probability of making the WRONG conclusion). In biology, we use a standard “p-value” of 0.05. This means that five times out of a hundred you would find a statistically significant difference between the means even if there was none.
- Calculate the mean (X) of each sample
- Find the absolute value of the difference between the means
- Calculate the standard deviation for each sample
- Square the standard deviation for each sample
- Divide each squared standard deviations by the sample size of that group.
- Add these two values
- Take the square root of the number to find the "standard error of the difference.
- Divide the difference in the means (step 2) by the standard error of the difference (step 7). The answer is your "calculated T-value."
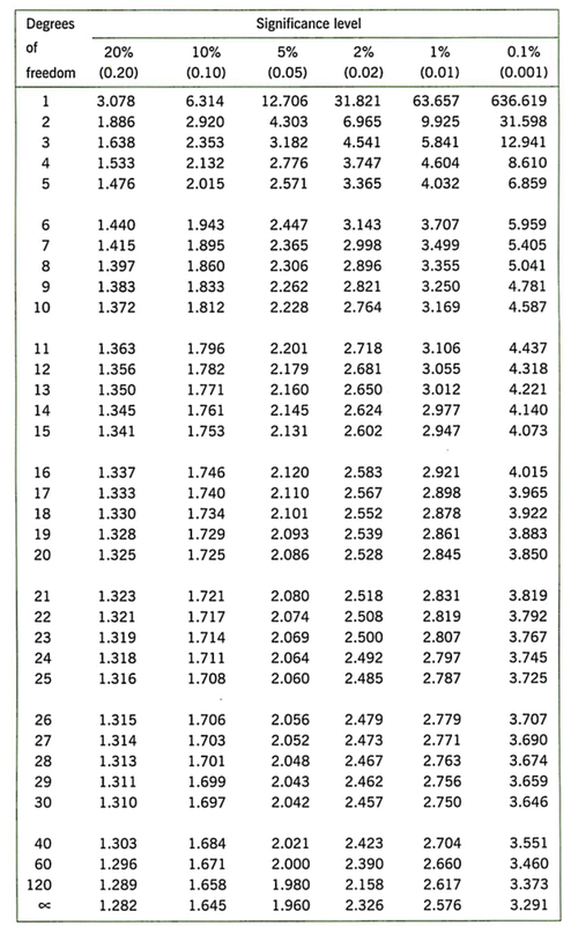
- Determine the degrees of freedom (df) for the test. In the t-test, the degrees of freedom is the sum of the sample sizes of both groups minus 2.
- Determine the “Critical T-value” in a table by triangulating your DF and the “p value” of 0.05.
- Draw your conclusion:
If your calculated t value is greater than the critical T-value from the table, you can conclude that the difference between the means for the two groups is significantly different. We reject the null hypothesis and conclude that the alternative hypothesis is correct.
If your calculated t value is lower than the critical T-value from the table, you can conclude that the difference between the means for the two groups is NOT significantly different. We accept the null hypothesis.
A p-value s the probability of concluding there is a significant difference between the groups result when the null hypothesis is true (meaning, the probability of making the WRONG conclusion). In biology, we use a standard “p-value” of 0.05. This means that five times out of a hundred you would find a statistically significant difference between the means even if there was none.
Key Terms
|
mean data set
correlation uncertainties |
standard deviation
significance cormorants chi-square |
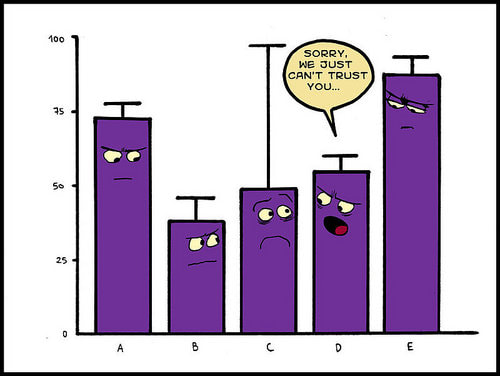
error bars
significant number degree of freedom r value |
causation
correlation p value probability |
t-test
variable range standard error |
Class Materials:
Error Analysis
Significant Figures
Precision Measurements and Uncertainties
Precision Lab
Topic 1 Statistics (ppt)
Biostatistics Practical Problems
Graphing In Edexcel
Graphing in Edexcel Practice problems
Standard Deviation (ppt)
Standard Deviation (notes)
Standard Deviation Practice problems
Hydroponics Standard Deviation Practice problems
t-Test (ppt)
t-Test (notes)
Correlation and Causation (ppt)
Correlation and Causation (notes)
Correlation reading
Correlations of cancer (pdf)
Data set #1 (pdf)
Data set #2 (pdf)
Data set #3 (pdf)
T-test reading
T-Testing in Biology University of
Statistics Review
Useful Links
Review of means
Click here for calculating SD with tools
Click here for Flash Card questions on Statistical Analysis
Click here for tips on Excel graphing.
“Using error bars in experimental Biology” by Geoff Cumming, Fiona Fidler, and David L. Vaux. (Journal of Cell Biology)
Are two sets of data really different?Click here to perform Student’s t-test
Click here to perform Student’s t-test via copy and paste
Example graph (from The Biology Teacher, September 2013)
Graphic Calculator Tour
Easy Calculation
Statistics calculator
MERLIN software for Excel
Chi-square calculator
Chi-square table
T-test calculator
Standard deviation reading
T-Test Table, Excel and calculations can be found here.
There are many statistical tools to establish a statistically significant correlation. read more here or read an article about Cause and Correlation by Wisegeek here.
Difference Between Correlation and Causation article
Excellent Handbook of Biological Statistics from John MacDonald
Basic Statistical Tools, from the Natural Resources Management Department
And The Little Handbook of Statistical Practice is very useful.
Sumanas statistics animations
Field Studies Council stats page, including the t-test
Open Door Website stats page and help with graphs and tables.
Making Population Pyramids on Excel
Spreadsheet Data Analysis Tutortial
Video over Table
Making Table g
Making Tables
This is an ecocolumn design you can use in the long-term IA’s 1 - from learner.org
Here’s another ecocolumn design you can use for the long-term IA project - from fastplants.org
In The News:
Ed Yong writes for Cancer Research UK on the WHO’s verdict on mobile phones and cancer. Correlation vs cause!
Epidemiology: The Science of Cohort Studies. How do we generate lifetimes’ worth of data in studies in medicine? Ben Goldacre’s BBC Radio 4 documentary, Science: From Cradle to Grave. An amazing discipline to work in, and one birth cohort study has been running for over 65 years!
Click here for a funny article on the 9 circles of scientific hell.
Video Clips
Watch Hans Rosling’s brilliant Joy of Statistics here. For a short clip:
