internal assessment - exploration
Exploration
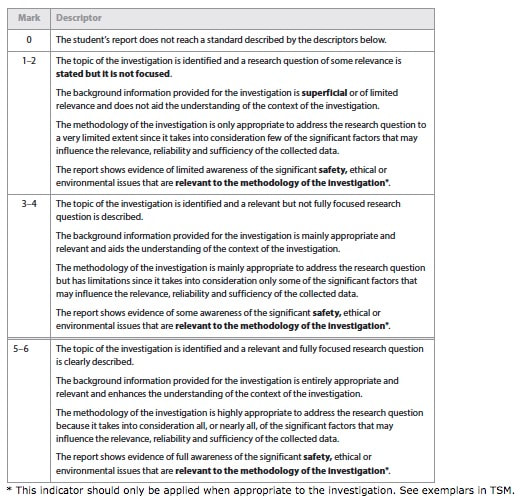
This criterion assesses the extent to which the student establishes the scientific context for the work, states a clear and focused research question and uses concepts and techniques appropriate to the Diploma Programme level. Where appropriate, this criterion also assesses awareness of safety, environmental, and ethical considerations.
Research Question:
There should be a single sentence which clearly and specifically states the objective of the investigation. Recognize the nature of the problem that has been set, the factors (variables) that will affect the outcome, and how they affect it (the hypothesis). The research question must clearly identify the manipulated and responding variables of the investigation
If you are using any living organisms, or products from living organisms, such as seeds from a certain plant, give the most precise name you can and give the scientific name if possible (e.g. Phaseolus vulgaris for kidney beans).
Although not required by the IB Organization, for many investigations it is appropriate for students to include a hypothesis. A hypothesis is like a prediction. It will often take the form of a proposed relationship between two or more variables that can be tested by experiment: “If X is done, then Y will occur.” Also provide an explanation for the hypothesis. This should be a brief discussion (paragraph form) about the theory or ‘why’ behind the hypothesis and prediction. Be sure the hypothesis is related directly to the research question and that the manipulated and responding variables for the experiment are clear. (Examples: “The rate of transpiration will increase as wind speeds and temperatures rise” or “Brand X toothpaste will be more effective in preventing the growth of the bacteria which causes plaque on your teeth”).
Be sure your hypothesis is related directly to your research question and that the manipulated and responding
variables for your experiment are clear.
Background:
Write a paragraph or two explaining why the experiment is appropriate and relevant to the study of biology. How does it relate to what is being learned in class? What process or phenomenon will the experiment support?
Methodology:
Make a list of materials needed. Be as specific as possible (example: “50 mL beaker instead of ‘beaker’). A well labeled diagram or photograph of how the experiment is set up may be appropriate. Be sure the diagram includes a title and any necessary labels.
State or discuss the method (procedure) that was used in the experiment. This should be in the form of a step-by-step direction. Provide enough detail so that another person could repeat your work by reading the report! You don’t have to go into detail about standard, well-understood actions. If a standard technique is used, it should be referenced.
If something is done in the procedure to minimize an anticipated error, mention this as well. (Example: “Carefully cutting plant stem under water to reduce affect of air on transpiration rate.”)
In the method, clearly state how to collect data. What measuring device was used, what data was recorded and when? Or what qualitative observations were looked for (such as color change)?
The procedure must allow collection of sufficient relevant data. As a rule, the lower limit is five measurements, or a sample size of five. Very small samples run from 5 to 20, small samples run from 20 to 30, and big samples run from 30 upwards. Obviously, this will vary within the limits of the time available for an investigation.
The data range and amount of data in that range are also important. For example, when trying to determine the optimum pH of an enzyme, using a range of pH values between 6 and 8 would be insufficient. Using a range of values between 3 and 10 would be better, but would also be insufficient if only three different pH values were tested in that range.
“Control of variables” refers to the manipulation of the independent variable and the attempt to maintain the controlled variables at a constant value.
Safety, Ethics and Environmental Issues:
This criterion assesses the extent to which the student establishes the scientific context for the work, states a clear and focused research question and uses concepts and techniques appropriate to the Diploma Programme level. Where appropriate, this criterion also assesses awareness of safety, environmental, and ethical considerations.
Research Question:
- The research questions is clearly stated and precisely formulated.
- Research question includes clear IV and DV.
- Research question includes scientific name of organism, if relevant (Genus species).
- The research question can be used to formulate a hypothesis predicting the relationship between the MV and IV.
- Hypothesis explanation is scientifically accurate (with correctly cited sources).
There should be a single sentence which clearly and specifically states the objective of the investigation. Recognize the nature of the problem that has been set, the factors (variables) that will affect the outcome, and how they affect it (the hypothesis). The research question must clearly identify the manipulated and responding variables of the investigation
If you are using any living organisms, or products from living organisms, such as seeds from a certain plant, give the most precise name you can and give the scientific name if possible (e.g. Phaseolus vulgaris for kidney beans).
Although not required by the IB Organization, for many investigations it is appropriate for students to include a hypothesis. A hypothesis is like a prediction. It will often take the form of a proposed relationship between two or more variables that can be tested by experiment: “If X is done, then Y will occur.” Also provide an explanation for the hypothesis. This should be a brief discussion (paragraph form) about the theory or ‘why’ behind the hypothesis and prediction. Be sure the hypothesis is related directly to the research question and that the manipulated and responding variables for the experiment are clear. (Examples: “The rate of transpiration will increase as wind speeds and temperatures rise” or “Brand X toothpaste will be more effective in preventing the growth of the bacteria which causes plaque on your teeth”).
Be sure your hypothesis is related directly to your research question and that the manipulated and responding
variables for your experiment are clear.
Background:
- The background sets the research question into context.
- Appropriate and relevant background biology correctly described and explained.
- Citations relevant to the research question are used.
- Background information is used to form a hypothesis.
- Null and alternative hypothesis given if a statistical test of significance is used.
- If relevant, a predicted graph is used to illustrate the hypothesis.
Write a paragraph or two explaining why the experiment is appropriate and relevant to the study of biology. How does it relate to what is being learned in class? What process or phenomenon will the experiment support?
Methodology:
- IV correctly identified with units and levels, including how the levels were chosen.
- Minimum of five levels of IV over a suitable range (unless comparing populations or correlating variables without manipulation).
- DV (as directly recorded and/or calculated) correctly identified with units.
- Important CV identified, with the potential impact of each discussed. Validity measures and/or control group are not misunderstood as CV.
- List or photo of apparatus and materials including size, graduation and uncertainty.
- Reference to preliminary trials, if completed.
- Method to change and measure IV fully detailed (including tools, units and uncertainty).
- Method for measuring DV fully detailed (including tools, units and uncertainty).
- Sufficient repeats of DV measurement to ensure reliability and allow for statistics (5 for SD, 10 for T-test, 20+for correlation).
- Collection of data from other students or sources is explained and referenced.
- If sampling only a portion of a population, include the method for ensuring the sample was randomly selected.
- Method for maintaining and measuring CV is detailed (including tools, units and uncertainty).
- Method includes validity measures to ensure experimental measurements are valid and consistent.
- Method is clear, specific and easily replicated as described.
- Full citation of a published protocol (or elements of), if used.
Make a list of materials needed. Be as specific as possible (example: “50 mL beaker instead of ‘beaker’). A well labeled diagram or photograph of how the experiment is set up may be appropriate. Be sure the diagram includes a title and any necessary labels.
State or discuss the method (procedure) that was used in the experiment. This should be in the form of a step-by-step direction. Provide enough detail so that another person could repeat your work by reading the report! You don’t have to go into detail about standard, well-understood actions. If a standard technique is used, it should be referenced.
If something is done in the procedure to minimize an anticipated error, mention this as well. (Example: “Carefully cutting plant stem under water to reduce affect of air on transpiration rate.”)
In the method, clearly state how to collect data. What measuring device was used, what data was recorded and when? Or what qualitative observations were looked for (such as color change)?
The procedure must allow collection of sufficient relevant data. As a rule, the lower limit is five measurements, or a sample size of five. Very small samples run from 5 to 20, small samples run from 20 to 30, and big samples run from 30 upwards. Obviously, this will vary within the limits of the time available for an investigation.
The data range and amount of data in that range are also important. For example, when trying to determine the optimum pH of an enzyme, using a range of pH values between 6 and 8 would be insufficient. Using a range of values between 3 and 10 would be better, but would also be insufficient if only three different pH values were tested in that range.
“Control of variables” refers to the manipulation of the independent variable and the attempt to maintain the controlled variables at a constant value.
- describe how the control of variables is achieved. If the control of variables is not practically possible, some effort should be made to monitor the variable(s).
- state an explicit procedure or method for how each variable will be controlled and monitored.
- if using a known experimental protocol, you must explain how you modified the standard method to make it your own.
Safety, Ethics and Environmental Issues:
- Safety issues fully considered (including human consent forms if needed).
- Ethical issues fully considered (including animal experimentation policy if needed).
- Environmental issues fully considered (such as reduction of waste and disposal of chemicals).
- List any safety precautions that must be taken during the lab, including personal and environmental concerns.
Measurement Precision
Unless there is a digital display, always measure to one digit beyond the smallest unit of CERTAIN measurement of the tool. For example, if you use a ruler that can accurately measure to the tenth of a centimeter, your measurement would be to the hundredth of a centimeter. The number of significant digits should reflect the precision of the measurement.
There should be no variation in the precision of raw data. The same number of digits past the decimal place should be used. For data derived from processing raw data (i.e., means), the level of precision should be consistent with that of the raw data.
You may need to estimate the degree of precision sometimes especially with stop watches. Digital stop watches are said to be accurate to 0.01s but human reaction time is only +/-0.1s.
For electronic probes you may have to go to the manufacturer's specifications (on their web site or in the instructions manual).
Uncertainty
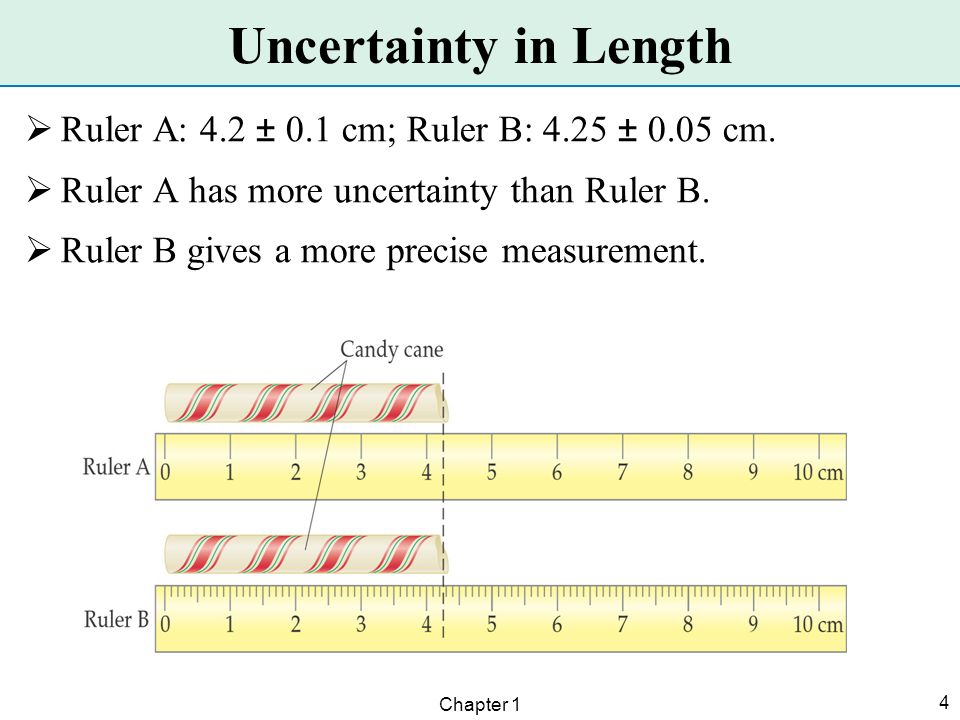
All measurements have uncertainties and are only as accurate as the tool being used to make the measurement. For general purposes, the accuracy of a measurement device is one half of the smallest measurement possible with the device. To determine uncertainty:
So, for example, the rulers in class measure to the millimeter (0.10 cm). Therefore, the ruler’s measurement uncertainty is +/- 0.05 cm.
The numerical value of a ± uncertainty value tells you the range of the result. For example a result reported as 1.23 ± 0.05 means that the experimenter has some degree of confidence that the true value falls in between 1.18 and 1.28.
Examples:
Experimental uncertainties should be rounded UP to one significant figure. Uncertainties are almost always quoted to one significant digit and we round up because it’s better to suggest higher uncertainty than to imply there is less uncertainty.
The measurement should have the same number of digits (decimal places) as the uncertainty. It would be confusing to suggest that you knew the digit in the hundredths (or thousandths) place when you admit that you unsure of the tenths place.
Just as for units, in a column of data students can show the uncertainty in the column heading and don’t have to keep re-writing if for every measurement in the table.
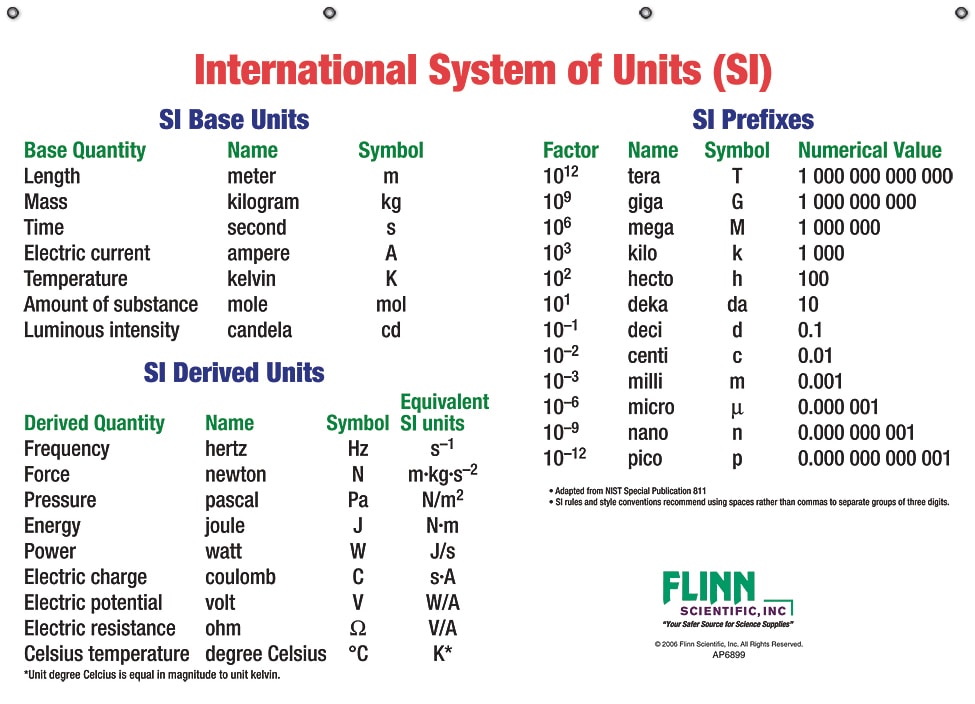
Units
A measurement must have units. The system of units used in science is called the International System of Units (SI units). In the table below are some of the more common SI units. When measuring time, it is acceptable to use minutes, days or hours when the experiment spans over a significant period of time. When showing length, it is acceptable to use the associated units shown in the table below.
For electronic probes you may have to go to the manufacturer's specifications (on their web site or in the instructions manual).
Uncertainty
All measurements have uncertainties and are only as accurate as the tool being used to make the measurement. For general purposes, the accuracy of a measurement device is one half of the smallest measurement possible with the device. To determine uncertainty:
- Find the smallest increment of measurement on your measurement device
- Divide it by two
- Round to the first non-zero number
So, for example, the rulers in class measure to the millimeter (0.10 cm). Therefore, the ruler’s measurement uncertainty is +/- 0.05 cm.
The numerical value of a ± uncertainty value tells you the range of the result. For example a result reported as 1.23 ± 0.05 means that the experimenter has some degree of confidence that the true value falls in between 1.18 and 1.28.
Examples:
- Mass of a penny on a centigram balance: 3.12g (+/- 0.05g)
- Temperature using a typical lab thermometer: 25.5°C (+/- 0.5°C)
Experimental uncertainties should be rounded UP to one significant figure. Uncertainties are almost always quoted to one significant digit and we round up because it’s better to suggest higher uncertainty than to imply there is less uncertainty.
- Wrong: ± 12.5 mL
- Correct: ± 20 mL
The measurement should have the same number of digits (decimal places) as the uncertainty. It would be confusing to suggest that you knew the digit in the hundredths (or thousandths) place when you admit that you unsure of the tenths place.
- Wrong: 1.237 s ± 0.1 s
- Correct: 1.2 s ± 0.1 s
Just as for units, in a column of data students can show the uncertainty in the column heading and don’t have to keep re-writing if for every measurement in the table.
Units
A measurement must have units. The system of units used in science is called the International System of Units (SI units). In the table below are some of the more common SI units. When measuring time, it is acceptable to use minutes, days or hours when the experiment spans over a significant period of time. When showing length, it is acceptable to use the associated units shown in the table below.
The following example shows different ways to express the same unit.
- Oxygen consumption (millilters per gram per hour)
- Oxygen consumption (ml/g/h)
- Oxygen consumption (ml g-1 h-1)